Problem breakdown
The panic log points to a stack protector failure inside mi_binder_wait4_hook:
Kernel log:
[41525.700710][T23239] Kernel panic - not syncing: stack-protector: Kernel stack is corrupted in: mi_binder_wait4_hook$835a4498e5ea78c0e09ecbebc9fc5a14+0x2f8/0x2fc [millet_binder]
[41525.700740][T23239] CPU: 5 PID: 23239 Comm: Recents-TaskRes Tainted: G        WC O      5.10.198-android12-9-00085-g226a9632f13d-ab11136126 #1
[41525.700753][T23239] Hardware name: Qualcomm Technologies, Inc. Parrot QRD, RUAN based on SM7435 (DT)
[41525.700761][T23239] Call trace:
[41525.700778][T23239]  dump_backtrace.cfi_jt+0x0/0x8
[41525.700788][T23239]  dump_stack_lvl+0xdc/0x138
[41525.700800][T23239]  panic+0x188/0x46c
[41525.700810][T23239]  printk_nmi_enter+0x0/0xc4
[41525.700822][T23239]  mi_binder_wait4_hook$835a4498e5ea78c0e09ecbebc9fc5a14+0x2f8/0x2fc [millet_binder]
[41525.700845][T23239] SMP: stopping secondary CPUs
At first glance, it looked like printk_nmi_enter() might just be part of the panic path, with some more important function omitted from the trace. That turns out to be the wrong interpretation. printk_nmi_enter here is not a valid clue to the real fault site; treating it as such leads the analysis in the wrong direction.
Reading the process stack
The assembly for mi_binder_wait_for_work() is:
0xffffffe3f7f6f524 <mi_binder_wait_for_work>:        paciasp
0xffffffe3f7f6f528 <mi_binder_wait_for_work+4>:        str        x30, [x18], #8
0xffffffe3f7f6f52c <mi_binder_wait_for_work+8>:        stp        x29, x30, [sp, #-64]!
0xffffffe3f7f6f530 <mi_binder_wait_for_work+12>:        str        x23, [sp, #16]
0xffffffe3f7f6f534 <mi_binder_wait_for_work+16>:        stp        x22, x21, [sp, #32]
0xffffffe3f7f6f538 <mi_binder_wait_for_work+20>:        stp        x20, x19, [sp, #48]
0xffffffe3f7f53c <mi_binder_wait_for_work+24>:        mov        x29, sp
The assembly for mi_binder_wait4_hook() is:
0xffffffe3f73f5914 <mi_binder_wait4_hook>:        paciasp
0xffffffe3f73f5918 <mi_binder_wait4_hook+4>:        sub        sp, sp, #0xf0
0xffffffe3f73f591c <mi_binder_wait4_hook+8>:        str        x30, [x18], #8
0xffffffe3f73f5920 <mi_binder_wait4_hook+12>:        stp        x29, x30, [sp, #160]
0xffffffe3f73f5924 <mi_binder_wait4_hook+16>:        str        x25, [sp, #176]
0xffffffe3f73f5928 <mi_binder_wait4_hook+20>:        stp        x24, x23, [sp, #192]
0xffffffe3f73f592c <mi_binder_wait4_hook+24>:        stp        x22, x21, [sp, #208]
0xffffffe3f73f5930 <mi_binder_wait4_hook+28>:        stp        x20, x19, [sp, #224]
0xffffffe3f73f5934 <mi_binder_wait4_hook+32>:        add        x29, sp, #0xa0
These are the two common stack-frame setup styles seen here:
stp x29, x30, [sp, #-64]!
This stores x29 at sp - 0x40 and x30 at sp - 0x40 + 0x8, then updates sp = sp - 0x40. In other words, the function allocates 4 rows of stack space for its frame, and sp now points to the top of that frame.
sub sp, sp, #0xf0
This simply does sp = sp - 0xf0, allocating 15 rows of stack space for the function frame.
After the registers are saved, instructions like mov x29, sp or add x29, sp, #0xa0 assign x29 to the memory location holding the fp/lr row, so that when control enters the next function, the current x29 can be pushed as the new frame pointer.
What is actually stored in a stack frame?
For example:
str        x23, [sp, #16]
stp        x29, x30, [sp, #-64]!
str stores one register, while stp stores a pair. Both are stack write operations.
sp points to the top of the current stack frame. sp + #16, or sp + 0x10, refers to the next row in memory; the rows are spaced by 0x10.
The important data to focus on here is:
x29: the frame pointer (fp). It records the memory address of the previous function'sfp/lrrow.x30: the link register (lr). It records the address of the instruction following the branch in the caller.x19 - x28: some of these may hold arguments before a branch, so their saved values can be read directly from the stack to inspect parameter values.

The next step after __stack_chk_fail() is panic(). The lr saved in the panic() stack frame should therefore be the address of the instruction immediately after the branch inside __stack_chk_fail(), which is 0xffffffe3fd73c6b4 + 0x4 = 0xffffffe3fd73c6b8.
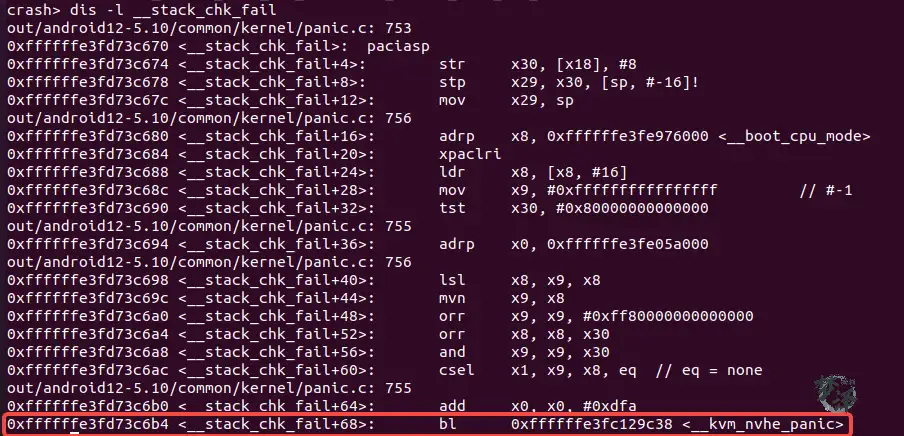
Disassembling 0xffffffe3fd73c6b8 shows printk_nmi_enter().
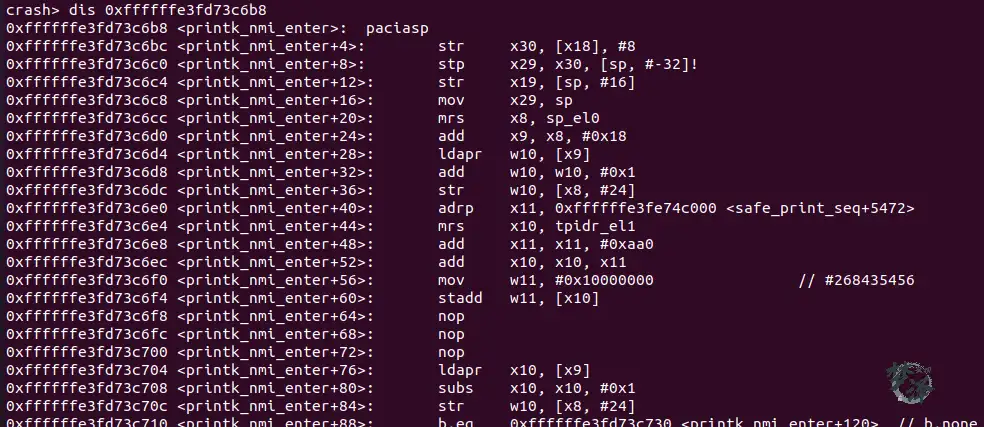
That is clearly wrong.
A reasonable fix would be to place a nop at the end of __stack_chk_fail() to avoid this misleading situation.
Verifying the process stack in Trace32
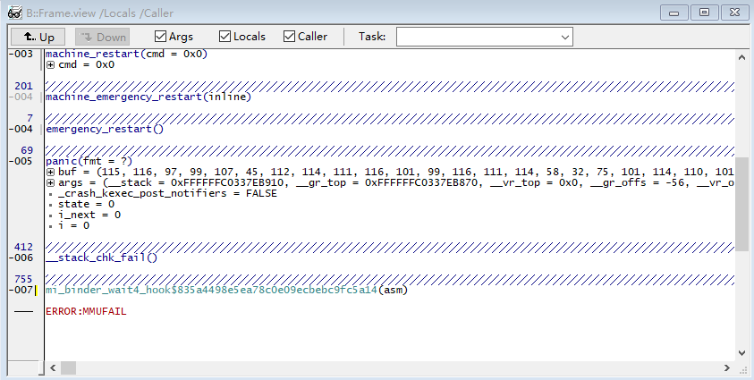
__stack_chk_fail() is the next step after mi_binder_wait4_hook(). Looking at the tail of mi_binder_wait4_hook():
0xffffffe3f73f5914 <mi_binder_wait4_hook$835a4498e5ea78c0e09ecbebc9fc5a14>:        paciasp
...
0xffffffe3f73f5bc0 <mi_binder_wait4_hook+684>:        adrp        x9, 0xffffffe3fe2e5000 <llcp_rawsock_ops+8>
0xffffffe3f73f5bc4 <mi_binder_wait4_hook+688>:        ldur        x8, [x29, #-8]
0xffffffe3f73f5bc8 <mi_binder_wait4_hook+692>:        ldr        x9, [x9, #3792]
0xffffffe3f73f5bcc <mi_binder_wait4_hook+696>:        cmp        x9, x8
0xffffffe3f73f5bd0 <mi_binder_wait4_hook+700>:        b.ne        0xffffffe3f73f5c08 <mi_binder_wait4_hook$835a4498e5ea78c0e09ecbebc9fc5a14+756>  // b.any
0xffffffe3f73f5bd4 <mi_binder_wait4_hook+704>:        ldp        x29, x30, [sp, #160]
0xffffffe3f73f5bd8 <mi_binder_wait4_hook+708>:        ldp        x20, x19, [sp, #224]
0xffffffe3f73f5bdc <mi_binder_wait4_hook+712>:        ldp        x22, x21, [sp, #208]
0xffffffe3f73f5be0 <mi_binder_wait4_hook+716>:        ldp        x24, x23, [sp, #192]
0xffffffe3f73f5be4 <mi_binder_wait4_hook+720>:        ldr        x25, [sp, #176]
0xffffffe3f73f5be8 <mi_binder_wait4_hook+724>:        ldr        x30, [x18, #-8]!
0xffffffe3f73f5bec <mi_binder_wait4_hook+728>:        add        sp, sp, #0xf0
0xffffffe3f73f5bf0 <mi_binder_wait4_hook+732>:        autiasp
0xffffffe3f73f5bf4 <mi_binder_wait4_hook+736>:        ret
0xffffffe3f73f5bf8 <mi_binder_wait4_hook+740>:        mov        w1, #0x3                           // #3
0xffffffe3f73f5bfc <mi_binder_wait4_hook+744>:        mov        x0, x20
0xffffffe3f73f5c00 <mi_binder_wait4_hook+748>:        bl        0xffffffe3fc9dd0b4 <refcount_warn_saturate>
0xffffffe3f73f5c04 <mi_binder_wait4_hook+752>:        b        0xffffffe3f73f5bc0 <mi_binder_wait4_hook$835a4498e5ea78c0e09ecbebc9fc5a14+684>
0xffffffe3f73f5c08 <mi_binder_wait4_hook+756>:        bl        0xffffffe3fd73c670 <__stack_chk_fail>
How to tell where execution stopped in the function
There are two reliable ways.
- In
mi_binder_wait4_hook$835a4498e5ea78c0e09ecbebc9fc5a14+0x2f8/0x2fc, the trailing+0x2f8/0x2fcmatters: -0x2f8is the offset of the running instruction. -0x2fcis the total function length.
If this is not the final function where panic occurred, that offset typically points to the instruction after a branch.
- The
lrrecorded in the process stack can also confirm it.
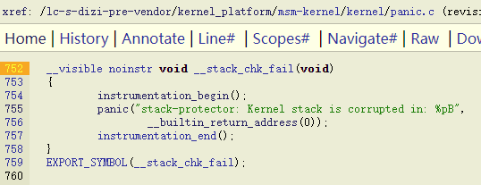
Looking into __stack_chk_fail(), the panic is triggered from there, which matches the error.
Deriving the faulting address
The start address of mi_binder_wait4_hook() is 0xffffffe3f73f5914.
Adding 0x2f8 gives:
0xffffffe3f73f5914 + 0x2f8 = 0xffffffe3f73f5c0c
That means execution had reached this line:
bl 0xffffffe3fd73c670 <__stack_chk_fail>
From the disassembly, this branch can only be reached from:
b.ne 0xffffffe3f73f5c08 <mi_binder_wait4_hook$+756> // b.anyb.ne 0xffffffe3f73f5c08 <mi_binder_wait4_hook$+756> // b.any
The jump happens because cmp x9, x8 found that x9 != x8. So the next step is to examine how x8 and x9 were assigned.
x9 is loaded as follows (adrp is equivalent here to preparing the base address, similar in effect to mov for the explanation):
adrp        x9, 0xffffffe3fe2e5000 <llcp_rawsock_ops+8>
ldr        x9, [x9, #3792] // x9 = bee1da79a4be8600
x8 comes from a value stored at x29 - 0x8. At function entry, 15 rows of stack space are allocated, x29 is set to sp - 0xf0 + 0xa0, the computed x8 value is stored to x29 - 0x8, and later x8 is loaded back from that same location:
sub        sp, sp, #0xf0
add        x29, sp, #0xa0
adrp        x8, 0xffffffe3fe2e5000 <llcp_rawsock_ops+8>
ldr        x8, [x8, #3792]
stur        x8, [x29, #-8]
ldur        x8, [x29, #-8]
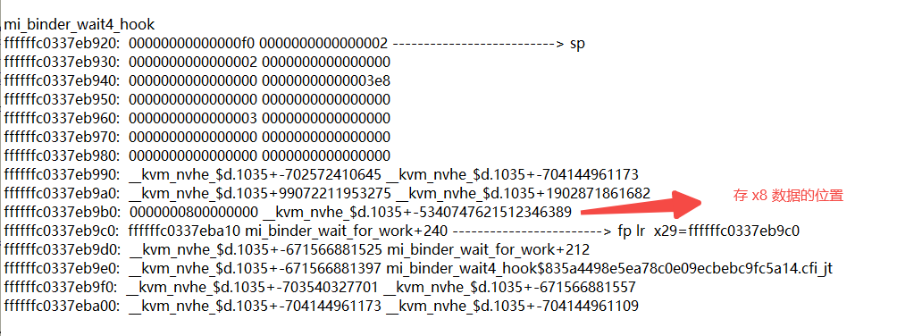
x9 evaluates to bee1da79a4be8600, and reading ffffffc0337eb9b8 also gives bee1da79a4be8600.
The problem appears when reading from x29 - 0x8: x29 has suffered a bit flip, so the load happens from the wrong address. That makes x8 differ from x9, which causes execution to branch into __stack_chk_fail() and eventually panic.
Root cause
At function entry, x29 is pushed, then add x29, sp, #0xa0 runs. That assigns sp + 0xa0—the address of the fp/lr row—to x29, so that when the next function is entered, this x29 can be saved as the caller's frame pointer.
That also means the fp recorded in the next stack frame can be used to inspect the value of x29. In this case, x29 clearly changed.
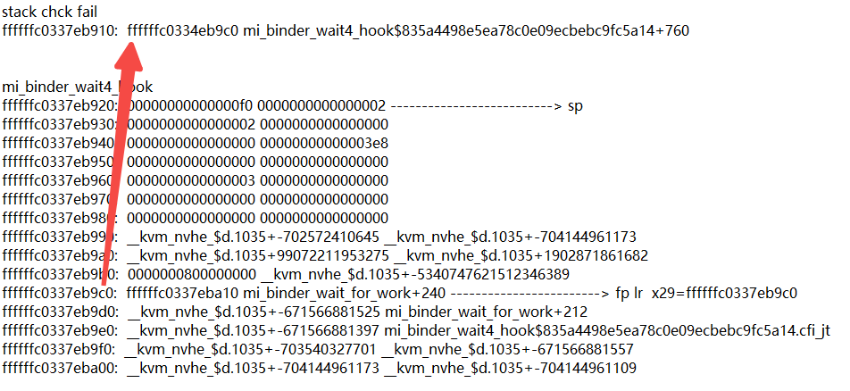
It changed from:
ffffffc0337eb9c0
into:
ffffffc0334eb9c0
Binary form of ffffffc0337eb9c0:
1111 1111 1111 1111 1111 1111 1100 0000 0011 0011 0111 1110 1011 1001 1100 0000
Binary form of ffffffc0334eb9c0:
1111 1111 1111 1111 1111 1111 1100 0000 0011 0011 0100 1110 1011 1001 1100 0000
Most likely, those two bits flipped. That corrupted x29, redirected the stack canary read to the wrong address, and ultimately triggered the stack-protector panic.