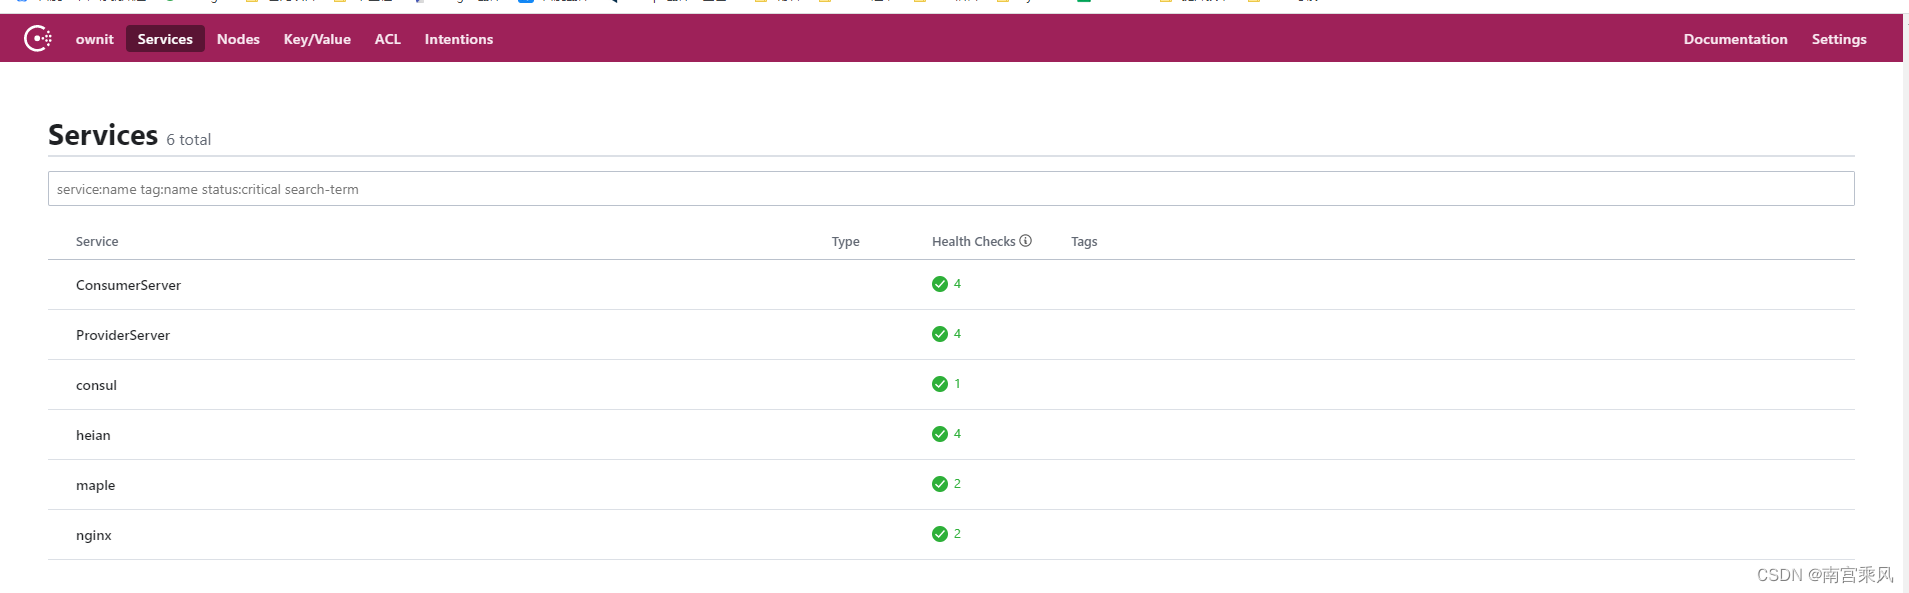
Consul is widely used for service discovery and configuration management in distributed systems. It helps track services and instances across a cluster. Prometheus, on the other hand, is a common open-source monitoring and alerting system that can collect metrics from many different components for analysis and alerting. Putting them together makes it easier to observe the health and behavior of a Consul cluster.
Setting up the Consul server
Consul version: Consul v1.5.3
Start by downloading the binary package for your operating system, then extract it and move the executable into a directory in your path.
<table> <thead> <tr> <th>1</th>
<th>unzip consul_1.x.x_linux_amd64.zip</th>
</tr>
</thead>
<tbody>
<tr>
<td></td>
<td></td>
</tr>
</tbody>
</table>
<table>
<thead>
<tr>
<th>1</th>
<th>sudo mv consul /usr/local/bin/</th>
</tr>
</thead>
<tbody>
<tr>
<td></td>
<td></td>
</tr>
</tbody>
</table>
Next, create the Consul server configuration file:
<table> <thead> <tr> <th>1 2 3 4 5 6 7 8 9 10 11 12 13 14 15 16 17 18 19 20</th>
<th>mkdir -p /etc/consul/ && cd /etc/consul/ [root@bt consul]# cat consul.hcl data_dir = "/var/lib/consul" log_level = "WARN" enable_syslog = true server = true bootstrap = true ui = true datacenter = "ownit" check_update_interval = "0s" bind_addr = "192.168.102.20" client_addr = "192.168.102.20" telemetry { prometheus_retention_time = "24h" #Consul自带的监控 disable_hostname = true } 该配置文件指定Consul服务端应该使用的数据中心、是否是服务器节点(server)、启动集群时期望的服务器数量(bootstrap_expect)、数据存储目录(data_dir)、日志级别(log_level)、是否启用syslog(enable_syslog)、是否启用UI(ui)以及HTTP地址(addresses.http)。</th>
</tr>
</thead>
<tbody>
<tr>
<td></td>
<td></td>
</tr>
</tbody>
</table>
This configuration defines the data center, enables server mode, sets the storage path, log level, syslog, and UI, and also turns on the built-in telemetry settings used by Prometheus.
To run Consul as a service, create a systemd unit:
<table> <thead> <tr> <th>1 2 3 4 5 6 7 8 9 10 11 12 13 14 15 16 17 18</th>
<th>vim /usr/lib/systemd/system/consul.service [Unit] Description=consul-server After=network-online.target [Service] User=consul PIDFile=/var/lib/consul/consul-server.pid ExecStart=/usr/bin/consul agent -config-dir /etc/consul -pid-file /var/lib/consul/consul-server.pid -log-file /var/log/consul/consul-server.log ExecReload=/bin/kill -s SIGHUP $MAINPID ExecStop=/bin/kill -INT $MAINPID [Install] WantedBy=multi-user.target systemctl daemon-reload && systemctl restart consul</th>
</tr>
</thead>
<tbody>
<tr>
<td></td>
<td></td>
</tr>
</tbody>
</table>
Prometheus architecture in brief
A Prometheus-based monitoring stack usually includes three main parts:
- Prometheus Server for storing and querying metrics.
- Exporter components that expose metrics from applications or services in a format Prometheus can scrape.
- Alertmanager for receiving alerts from Prometheus and handling notifications.
For Consul server monitoring, there are two practical approaches: use an exporter, or scrape Consul's own built-in metrics endpoint.
Method 1: Monitor Consul with Consul Exporter
One option is to expose Consul metrics through an exporter. This can be the official exporter or a third-party one. Here the example uses the official Consul Exporter.
Install Consul Exporter
Download the exporter package:
<table> <thead> <tr> <th>1</th>
<th>wget https://github.com/prometheus/consul_exporter/releases/download/v0.6.0/consul_exporter-0.6.0.linux-amd64.tar.gz</th>
</tr>
</thead>
<tbody>
<tr>
<td></td>
<td></td>
</tr>
</tbody>
</table>
Configure Consul Exporter
Create a systemd service file for it:
<table> <thead> <tr> <th>1 2 3 4 5 6 7 8 9 10 11 12 13 14 15 16 17 18</th>
<th>vim /usr/lib/systemd/system/consul_exporter.service [Unit] Description=Consul Exporter After=network.target [Service] Type=simple #User=conusl ExecStart=/usr/local/consul_exporter/consul_exporter --consul.server=192.168.102.20:8500 Restart=always [Install] WantedBy=multi-user.target systemctl daemon-reload && systemctl restart consul_exporter systemctl status consul_exporter</th>
</tr>
</thead>
<tbody>
<tr>
<td></td>
<td></td>
</tr>
</tbody>
</table>
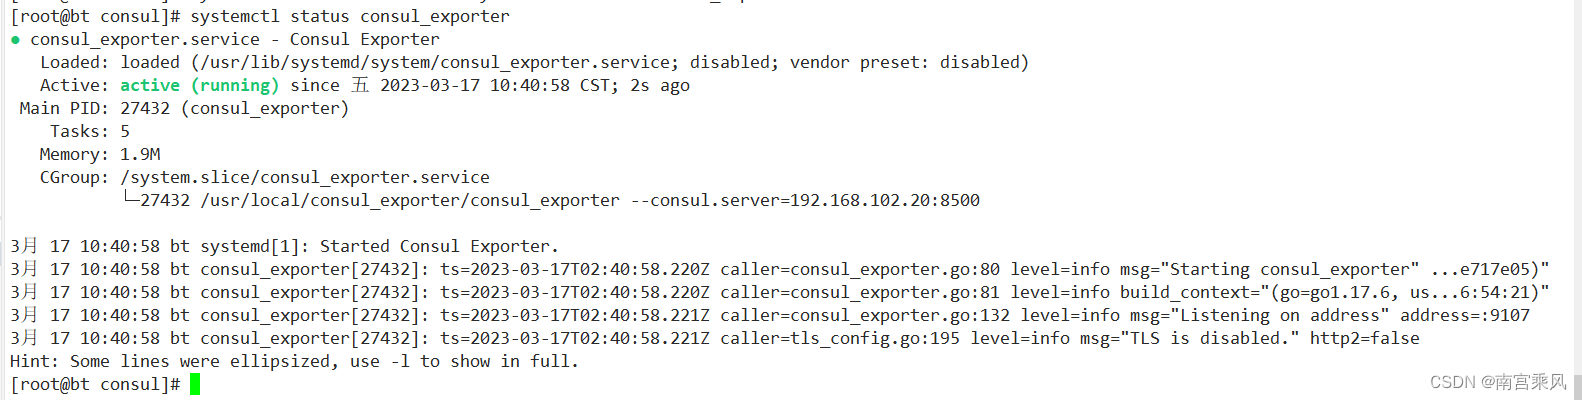
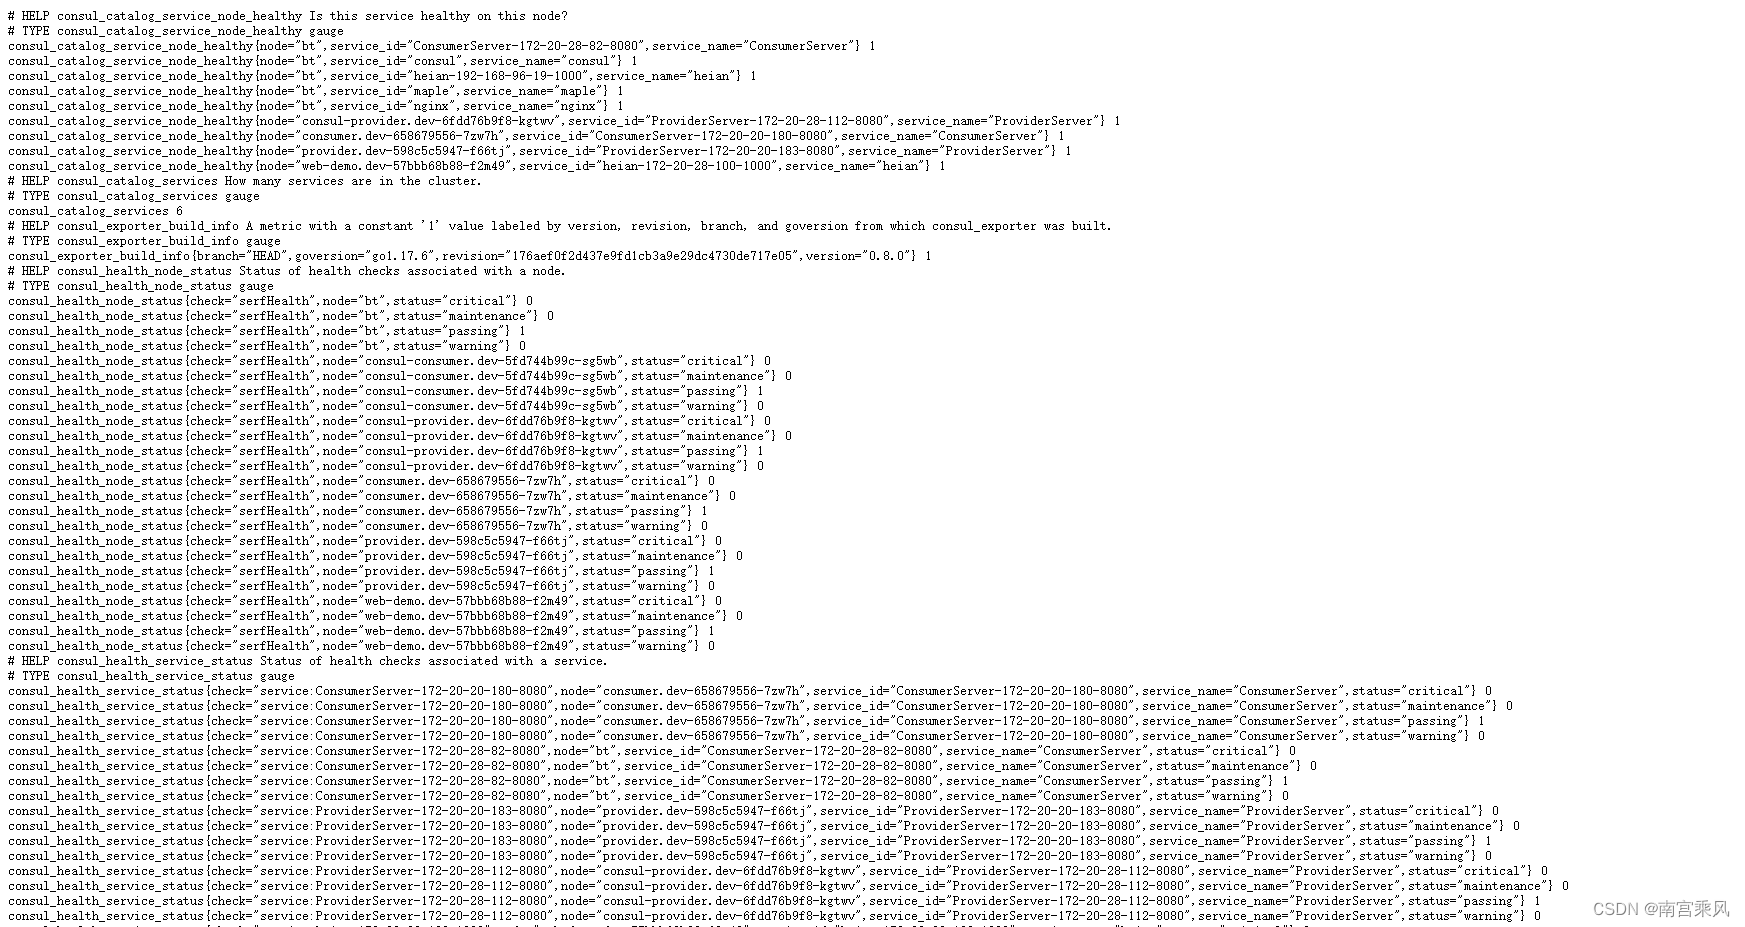
Once it is running, metrics are available at:
http://192.168.102.20:9107/metrics
Add the scrape job in Prometheus
Update the Prometheus configuration with a job for the exporter:
<table> <thead> <tr> <th>1 2 3 4 5</th>
<th>- job_name: 'consul' scrape_interval: 10s scrape_timeout: 10s static_configs: - targets: ['192.168.102.20:9107']</th>
</tr>
</thead>
<tbody>
<tr>
<td></td>
<td></td>
</tr>
</tbody>
</table>
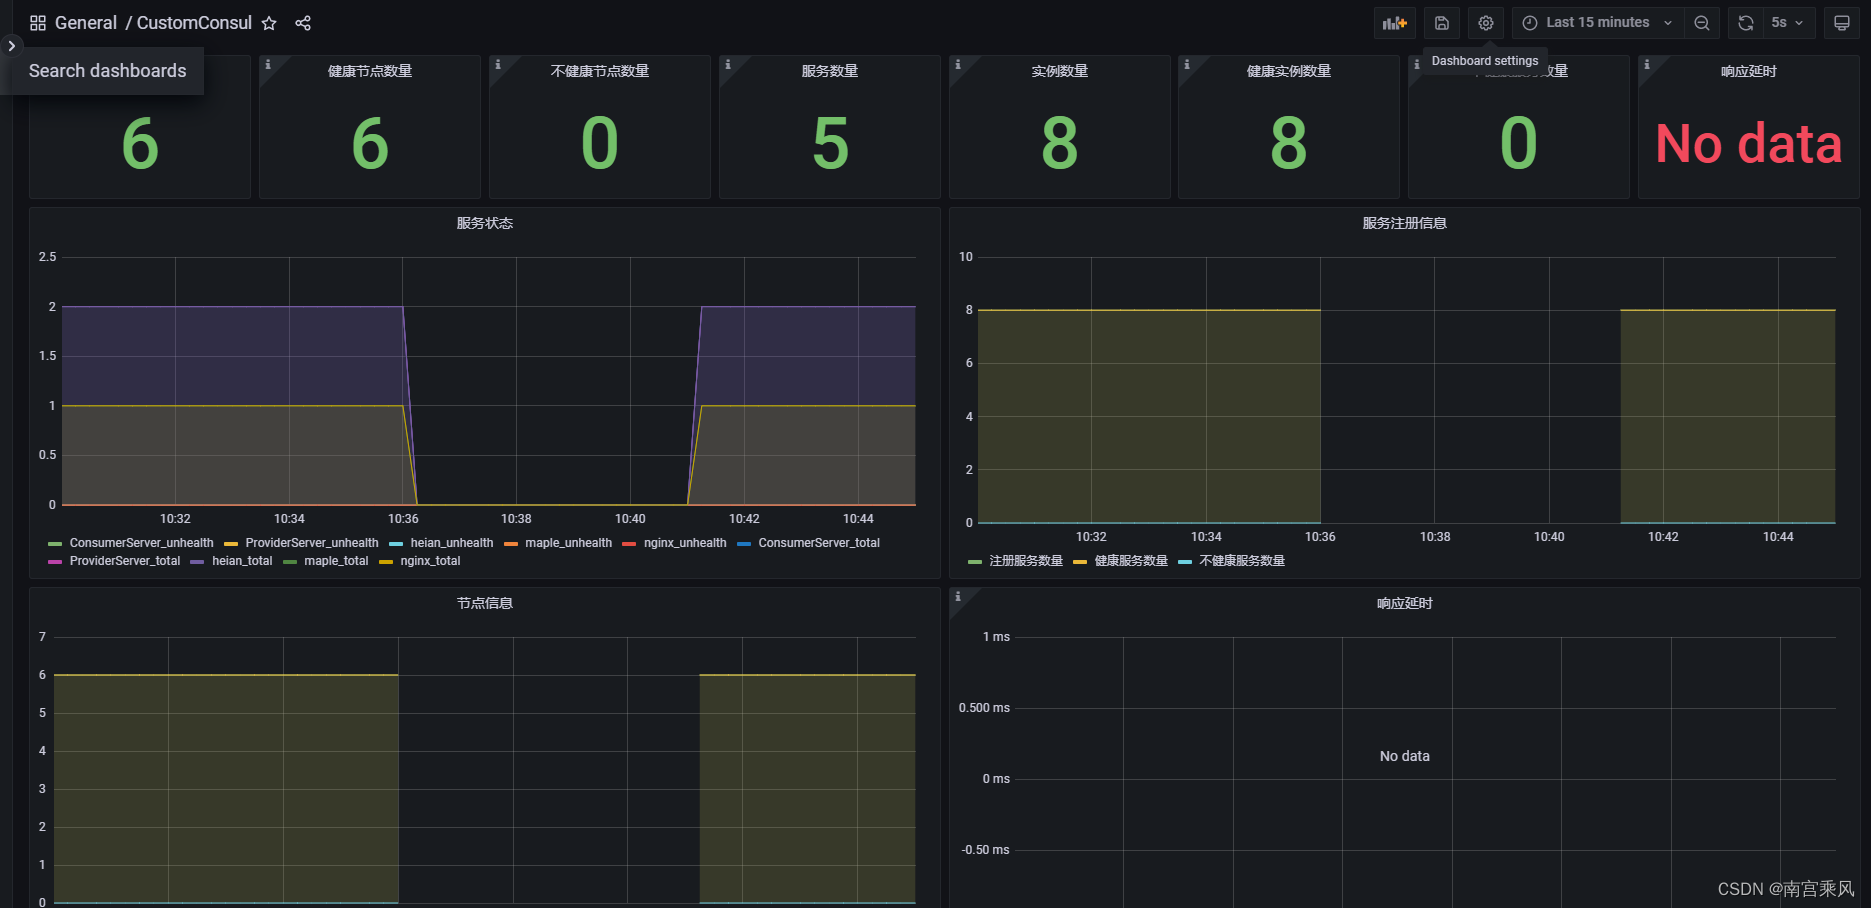
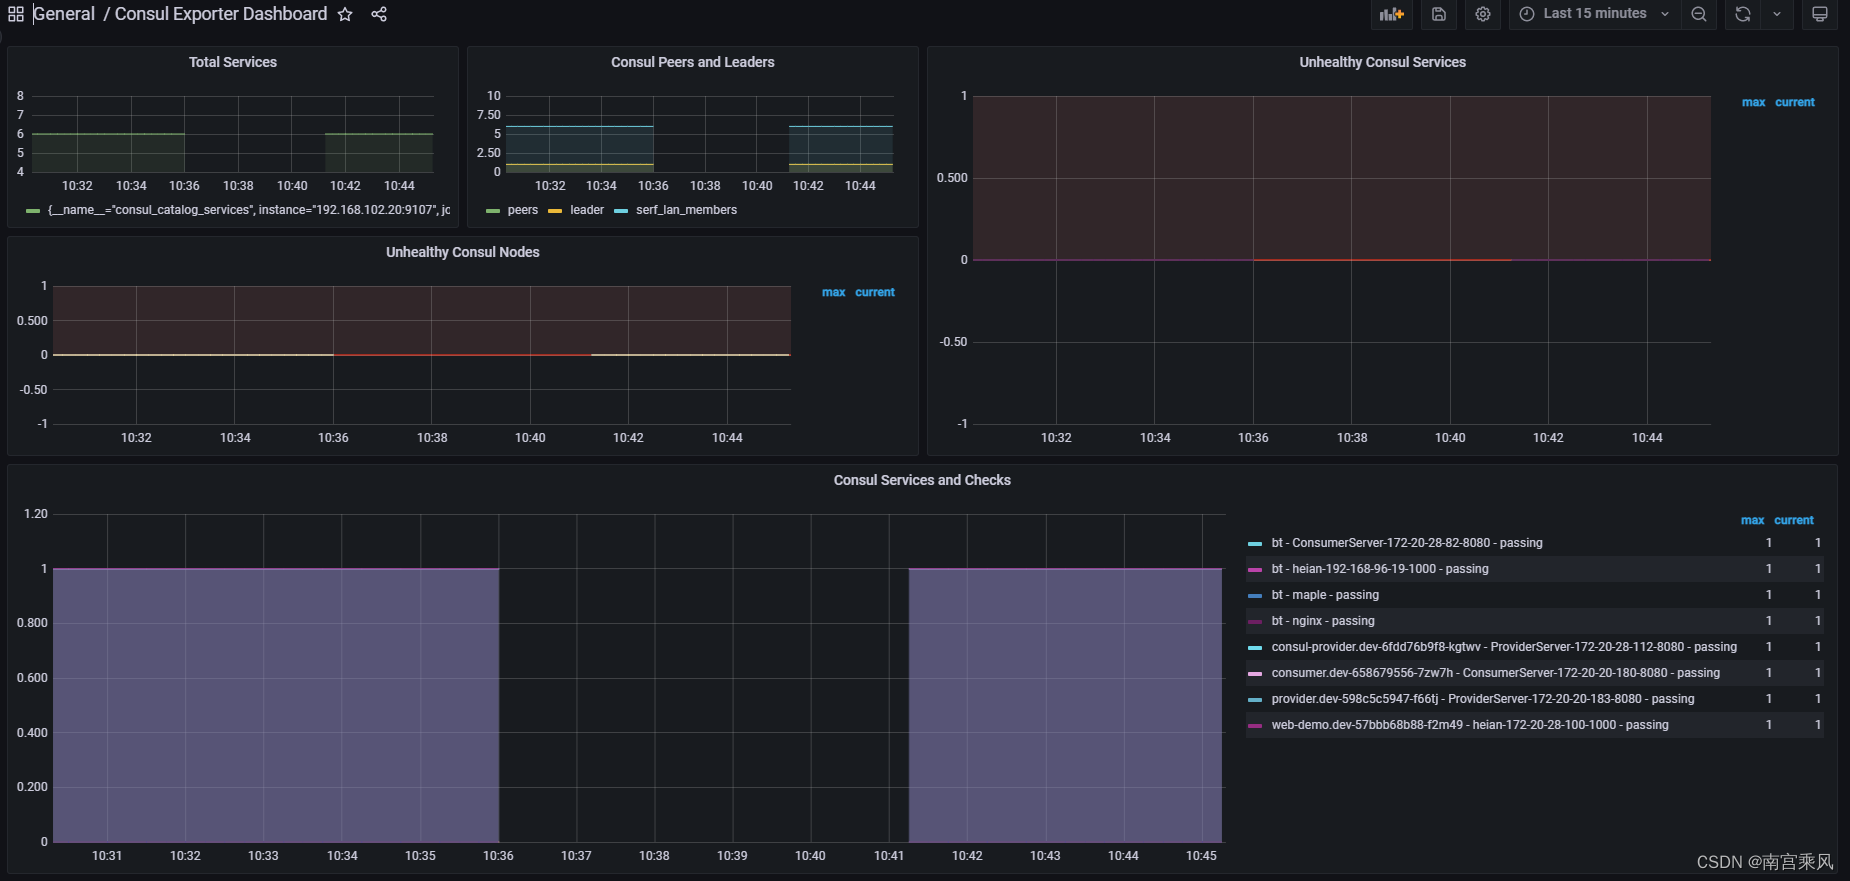
Import a Grafana dashboard
A dashboard template can be imported from:
https://hellowoodes.oss-cn-beijing.aliyuncs.com/picture/custom-consul-grafana-dashboard.json
Another available dashboard is:
https://grafana.com/grafana/dashboards/12049-consul-exporter-dashboard/
Method 2: Use Consul's built-in metrics
Consul can also expose Prometheus-compatible metrics directly, so an exporter is not always necessary.
Enable telemetry in Consul
Make sure the telemetry block is present in the Consul configuration:
<table> <thead> <tr> <th>1 2 3 4</th>
<th>telemetry { prometheus_retention_time = "24h" #Consul自带的监控 disable_hostname = true }</th>
</tr>
</thead>
<tbody>
<tr>
<td></td>
<td></td>
</tr>
</tbody>
</table>
Configure Prometheus to scrape Consul directly
Add this job to the Prometheus configuration:
<table> <thead> <tr> <th>1 2 3 4 5 6 7 8 9 10 11</th>
<th>- job_name: consul-server honor_timestamps: true scrape_interval: 15s scrape_timeout: 10s metrics_path: '/v1/agent/metrics' scheme: http params: format: ["prometheus"] static_configs: - targets: - 192.168.102.20:8500</th>
</tr>
</thead>
<tbody>
<tr>
<td></td>
<td></td>
</tr>
</tbody>
</table>
This setup tells Prometheus to scrape the Consul server on port 8500 and request metrics from /v1/agent/metrics in Prometheus format.
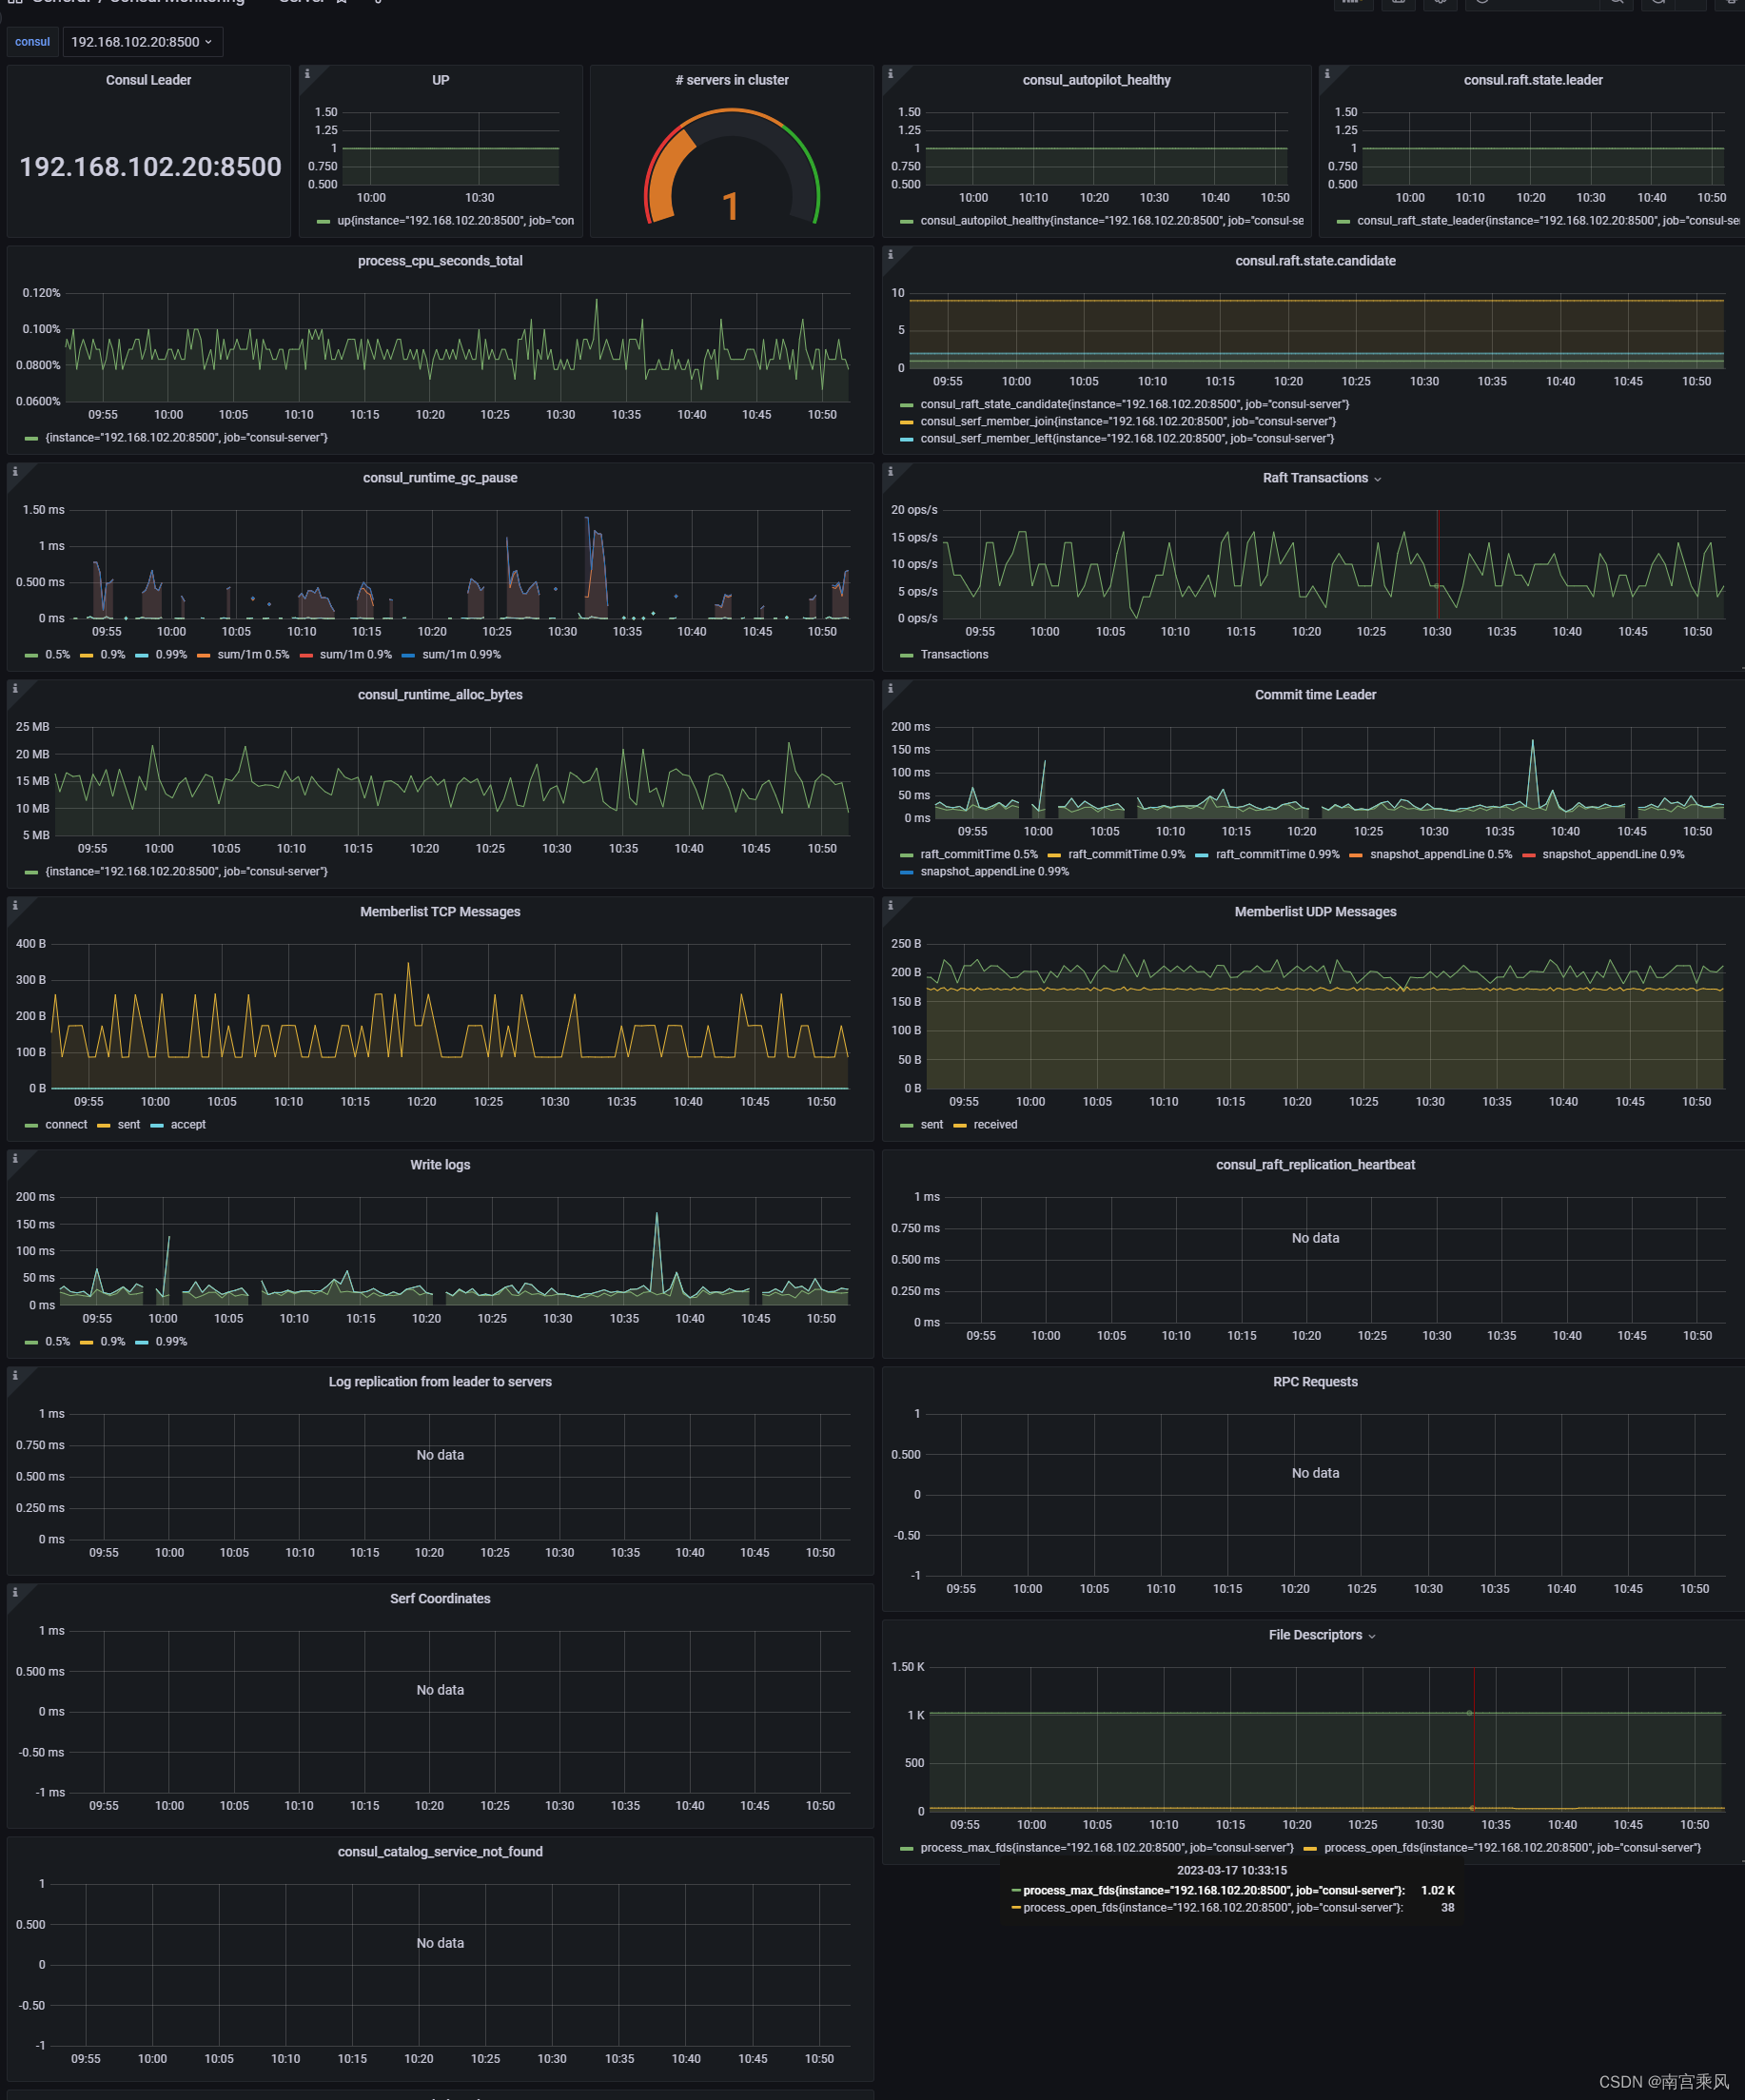
Import the Grafana dashboard
A matching dashboard is available here:
https://grafana.com/grafana/dashboards/2351-consul/
In Grafana, click the + button on the left, choose Import, enter Dashboard ID 10642, select the Prometheus data source that was added earlier, and click Import to load the monitoring panel.
Both approaches work for observing a Consul server with Prometheus and Grafana. If you want a separate exporter layer, use Consul Exporter. If you prefer a simpler path, Consul's own metrics endpoint can be scraped directly.