Monitoring Kubernetes Ingress with Kube-Prometheus
Kube-Prometheus packages the Prometheus stack for Kubernetes and makes cluster monitoring much easier to roll out. Once it is in place, one of the most practical things to monitor is Ingress, because it sits at the entry point for external traffic and directly affects service availability.
This walkthrough focuses on using Kube-Prometheus to collect metrics from Kubernetes Ingress, expose them to Prometheus, and build alerting and dashboards around them.
Prerequisites
Before starting, make sure the following components are already deployed in your Kubernetes environment:
- Kube-Prometheus
- An Ingress Controller, such as NGINX Ingress Controller
- A Kubernetes v1.23.0 cluster
What Ingress is doing in the cluster
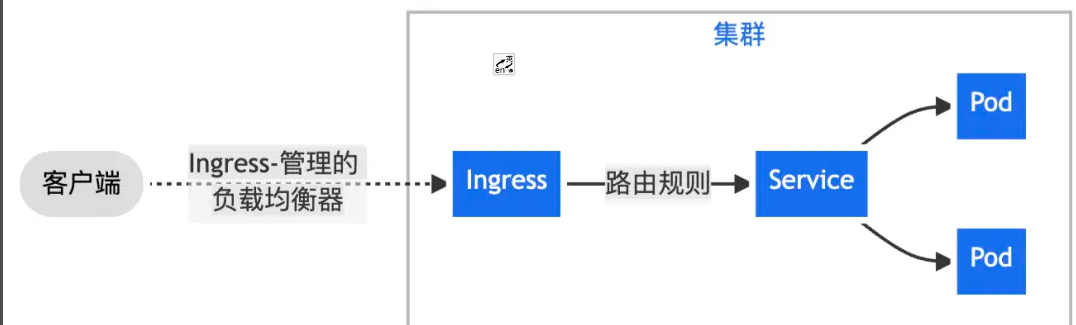
In many Kubernetes environments, Nginx Ingress is used to handle north-south traffic. It reads Ingress resources inside the cluster and turns them into actual routing rules. Ingress resources are typically used to expose HTTP services to the outside world.
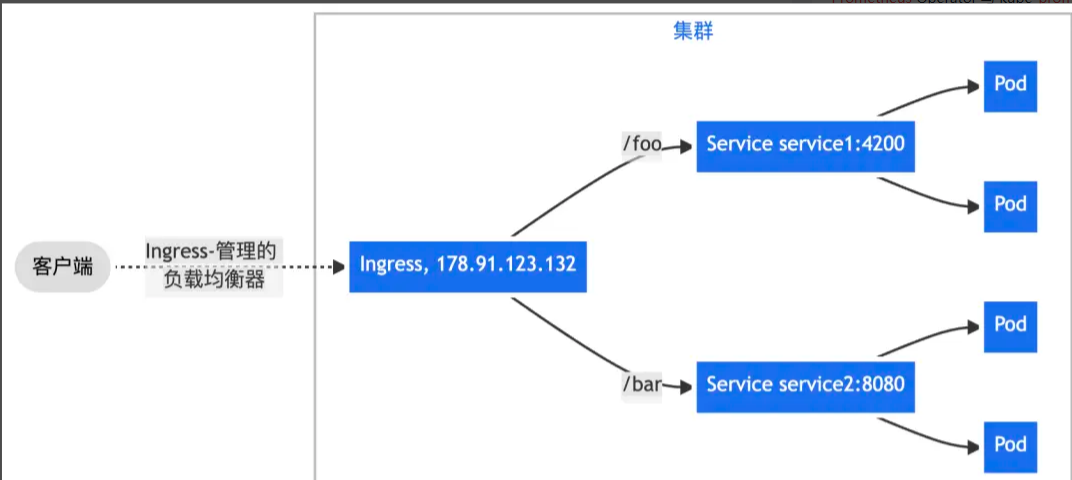
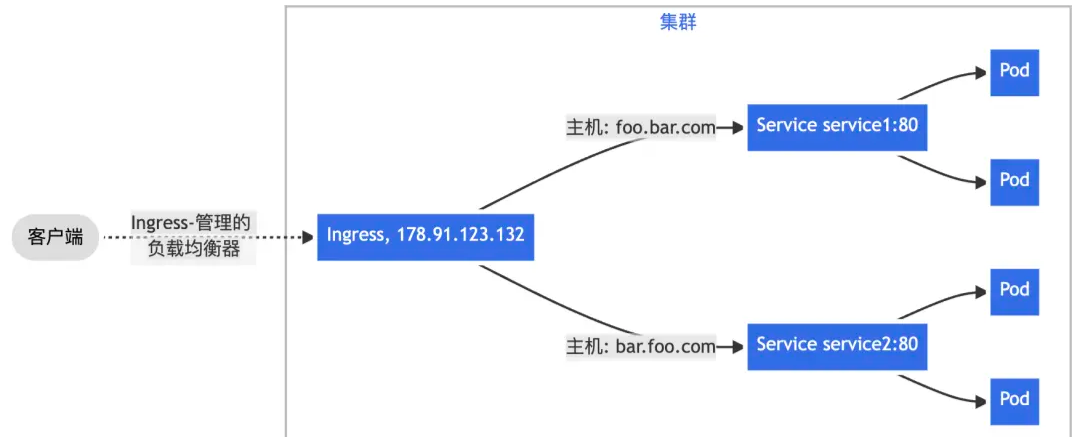
With Nginx Ingress plus Kubernetes Ingress resources, several common traffic patterns can be implemented:
- Send all client traffic through Nginx Ingress to a single Service.
- Route traffic from one bound IP to different Services based on URL path prefixes.
- Route traffic based on the HTTP
Hostheader, usually determined by the requested domain name, so one IP can serve multiple backend Services using name-based virtual hosting.
When monitoring an Nginx Ingress gateway, there are usually two categories of data worth watching most closely.
1. Workload resource usage
This is the health of the Nginx Ingress Controller Pod itself. If CPU, memory, or other resources become saturated, external traffic to the cluster can become unstable.
For workload monitoring, the usual recommendation is to follow the USE method:
- Utilization
- Saturation
- Errors
2. Ingress request traffic
This includes global traffic across the cluster, traffic for a specific Ingress rule, traffic reaching a specific Service, and the related success rate, error rate, latency, and even request-source analysis.
For request traffic monitoring, the key model is RED:
- Rate
- Errors
- Duration
The setup below is aimed at this second category.
Exposing the Ingress metrics endpoint
The metrics port for Ingress is:
10254
You can first check the Service and Pod state:
Update the Ingress Deployment
Add Prometheus scrape annotations and expose port 10254 in the deployment.
apiVersion: v1
kind: Deployment
metadata:
 annotations:
   prometheus.io/scrape: "true"
   prometheus.io/port: "10254"
..
spec:
 ports:
 - name: prometheus
   containerPort: 10254
..
重新apply一下yaml文件让修改的配置生效
kubectl apply -f ingress-deploy.yml
If the controller is already running, you can edit it directly:
kubectl edit deployments.apps -n ingress-nginx ingress-nginx-controller
ports:
- containerPort: 10254
  hostPort: 10254
  name: prometheus
  protocol: TCP
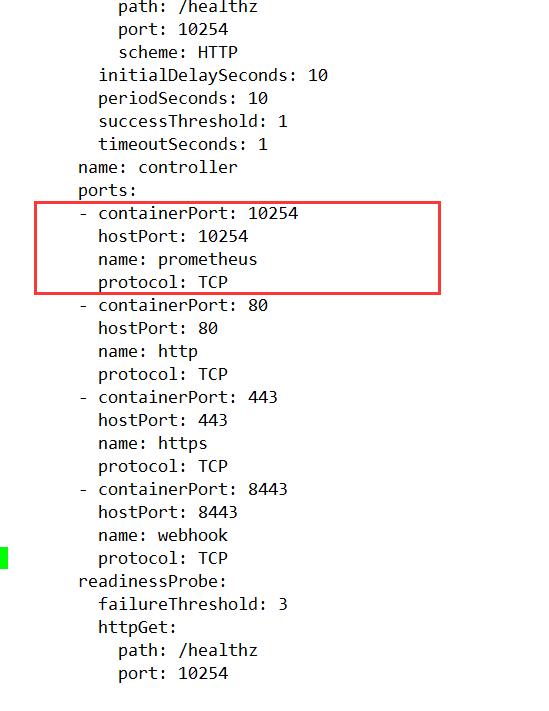
Save and exit after the change.
A deployment caveat came up in this setup: the Ingress controller was using hostNetwork and was pinned to node01. After saving, the controller restart failed because ports 80 and 443 were already occupied.
The workaround was:
- back up the original Ingress YAML
- delete the existing Ingress deployment
- recreate it from the YAML file
Relevant settings in that environment were:
hostNetwork: true
nodeName: node01
nodeSelector:
  kubernetes.io/os: linux
Update the Ingress Service
The Service also needs the Prometheus annotations and an exposed port for metrics:
apiVersion: v1
kind: Service
metadata:
 annotations:
   prometheus.io/scrape: "true"
   prometheus.io/port: "10254"
..
spec:
 ports:
 - name: prometheus
   port: 10254
   targetPort: 10254
..
A complete example looks like this:
---
apiVersion: v1
kind: Service
metadata:
  annotations:
    #svc 这一块必须要加,不然不会监控到
    prometheus.io/port: '10254'
    prometheus.io/scrape: 'true'
  labels:
    app.kubernetes.io/component: controller
    app.kubernetes.io/instance: ingress-nginx
    app.kubernetes.io/managed-by: Helm
    app.kubernetes.io/name: ingress-nginx
    app.kubernetes.io/version: 1.0.0
    helm.sh/chart: ingress-nginx-4.0.1
  name: ingress-nginx-controller
  namespace: ingress-nginx
spec:
  ports:
    - appProtocol: http
      name: http
      port: 80
      protocol: TCP
      targetPort: http
    - appProtocol: https
      name: https
      port: 443
      protocol: TCP
      targetPort: https
    - name: prometheus
      port: 10254
      protocol: TCP
      targetPort: prometheus
  selector:
    app.kubernetes.io/component: controller
    app.kubernetes.io/instance: ingress-nginx
    app.kubernetes.io/name: ingress-nginx
  sessionAffinity: None
  type: ClusterIP
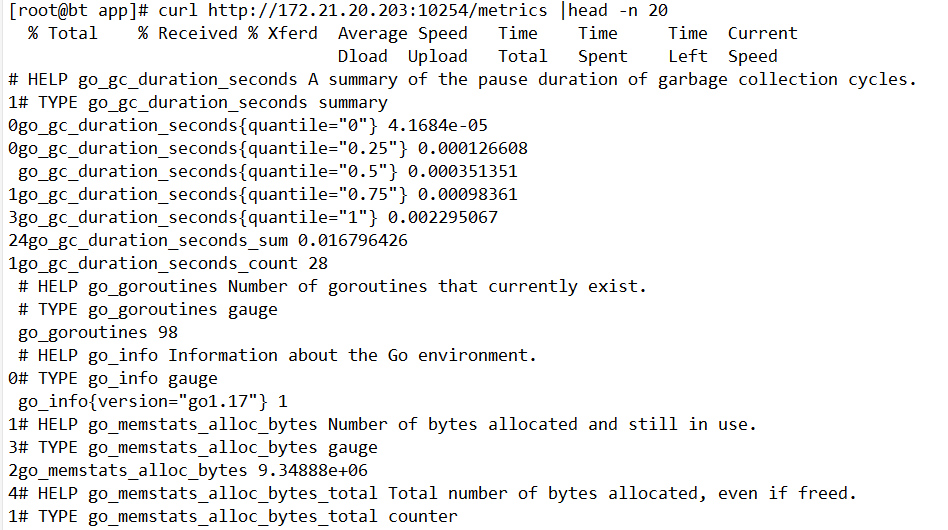
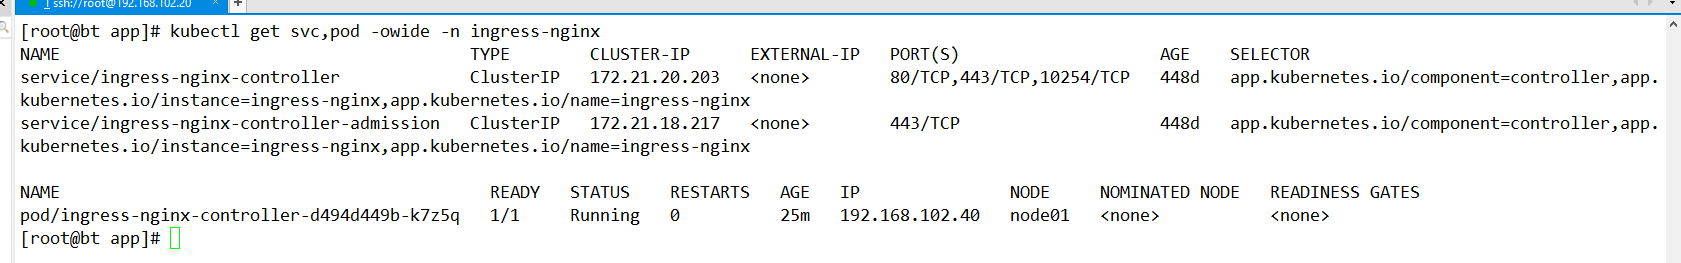
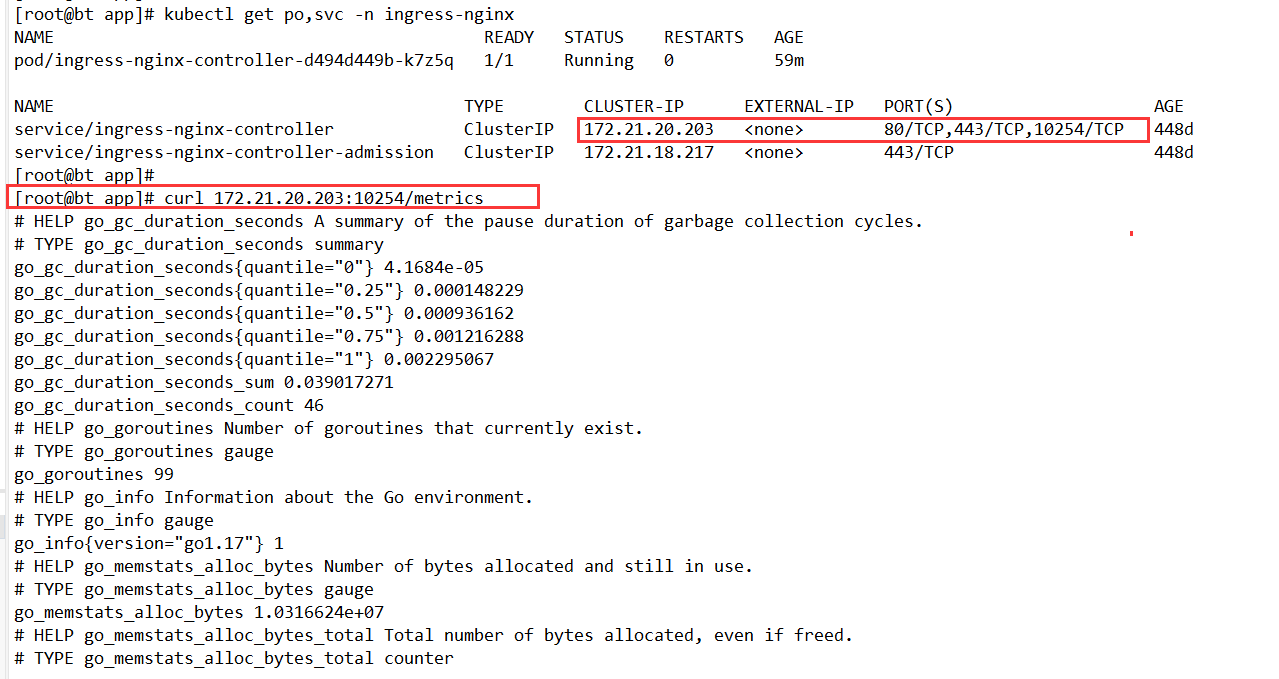
Verify that the metrics endpoint works
After the changes, confirm that the controller Service exposes 10254/TCP, then query /metrics directly.
[root@bt app]# kubectl get po,svc -n ingress-nginx
NAME                                           READY   STATUS    RESTARTS   AGE
pod/ingress-nginx-controller-d494d449b-k7z5q   1/1     Running   0          59m

NAME                                         TYPE        CLUSTER-IP      EXTERNAL-IP   PORT(S)                    AGE
service/ingress-nginx-controller             ClusterIP   172.21.20.203   <none>        80/TCP,443/TCP,10254/TCP   448d
service/ingress-nginx-controller-admission   ClusterIP   172.21.18.217   <none>        443/TCP                    448d
[root@bt app]#
[root@bt app]# curl 172.21.20.203:10254/metrics
# HELP go_gc_duration_seconds A summary of the pause duration of garbage collection cycles.
# TYPE go_gc_duration_seconds summary
go_gc_duration_seconds{quantile="0"} 4.1684e-05
go_gc_duration_seconds{quantile="0.25"} 0.000148229
go_gc_duration_seconds{quantile="0.5"} 0.000936162
go_gc_duration_seconds{quantile="0.75"} 0.001216288
go_gc_duration_seconds{quantile="1"} 0.002295067
go_gc_duration_seconds_sum 0.039017271
go_gc_duration_seconds_count 46
# HELP go_goroutines Number of goroutines that currently exist.
Creating a ServiceMonitor
Once the Service exposes metrics, Prometheus still needs a ServiceMonitor so Kube-Prometheus knows what to scrape.
Start by checking the labels on the Ingress Service:
[root@bt app]# kubectl get svc -n ingress-nginx --show-labels
NAME                               TYPE        CLUSTER-IP      EXTERNAL-IP   PORT(S)                    AGE    LABELS
ingress-nginx-controller           ClusterIP   172.21.20.203   <none>        80/TCP,443/TCP,10254/TCP   448d   app.kubernetes.io/component=controller,app.kubernetes.io/instance=ingress-nginx,app.kubernetes.io/managed-by=Helm,app.kubernetes.io/name=ingress-nginx,app.kubernetes.io/version=1.0.0,helm.sh/chart=ingress-nginx-4.0.1
ingress-nginx-controller-admission ClusterIP   172.21.18.217   <none>        443/TCP                    448d   app.kubernetes.io/component=controller,app.kubernetes.io/instance=ingress-nginx,app.kubernetes.io/managed-by=Helm,app.kubernetes.io/name=ingress-nginx,app.kubernetes.io/version=1.0.0,helm.sh/chart=ingress-nginx-4.0.1
Use those labels in the selector. The matching labels should not be guessed; they need to reflect the actual Service.
apiVersion: monitoring.coreos.com/v1
kind: ServiceMonitor
metadata:
  name: ingress-nginx
  namespace: monitoring
spec:
  endpoints:
  - interval: 15s
    port: prometheus
  namespaceSelector:
    matchNames:
    - ingress-nginx
  selector:
    matchLabels:
      #此处不是乱写的,要根据自己实际情况,查标签
      app.kubernetes.io/component: controller
      app.kubernetes.io/instance: ingress-nginx
      app.kubernetes.io/name: ingress-nginx
      app.kubernetes.io/version: 1.0.0
---
# 在对应的ns中创建角色
apiVersion: rbac.authorization.k8s.io/v1
kind: Role
metadata:
  name: prometheus-k8s
  namespace: ingress-nginx
rules:
- apiGroups:
  - ""
  resources:
  - services
  - endpoints
  - pods
  verbs:
  - get
  - list
  - watch
---
# 绑定角色 prometheus-k8s 角色到 Role
apiVersion: rbac.authorization.k8s.io/v1
kind: RoleBinding
metadata:
  name: prometheus-k8s
  namespace: ingress-nginx
roleRef:
  apiGroup: rbac.authorization.k8s.io
  kind: Role
  name: prometheus-k8s
subjects:
- kind: ServiceAccount
  name: prometheus-k8s # Prometheus 容器使用的 serviceAccount,kube-prometheus默认使用prometheus-k8s这个用户
  namespace: monitoring
The extra RBAC is important here because Prometheus, running in the monitoring namespace, needs permission to read Services, Endpoints, and Pods in ingress-nginx.
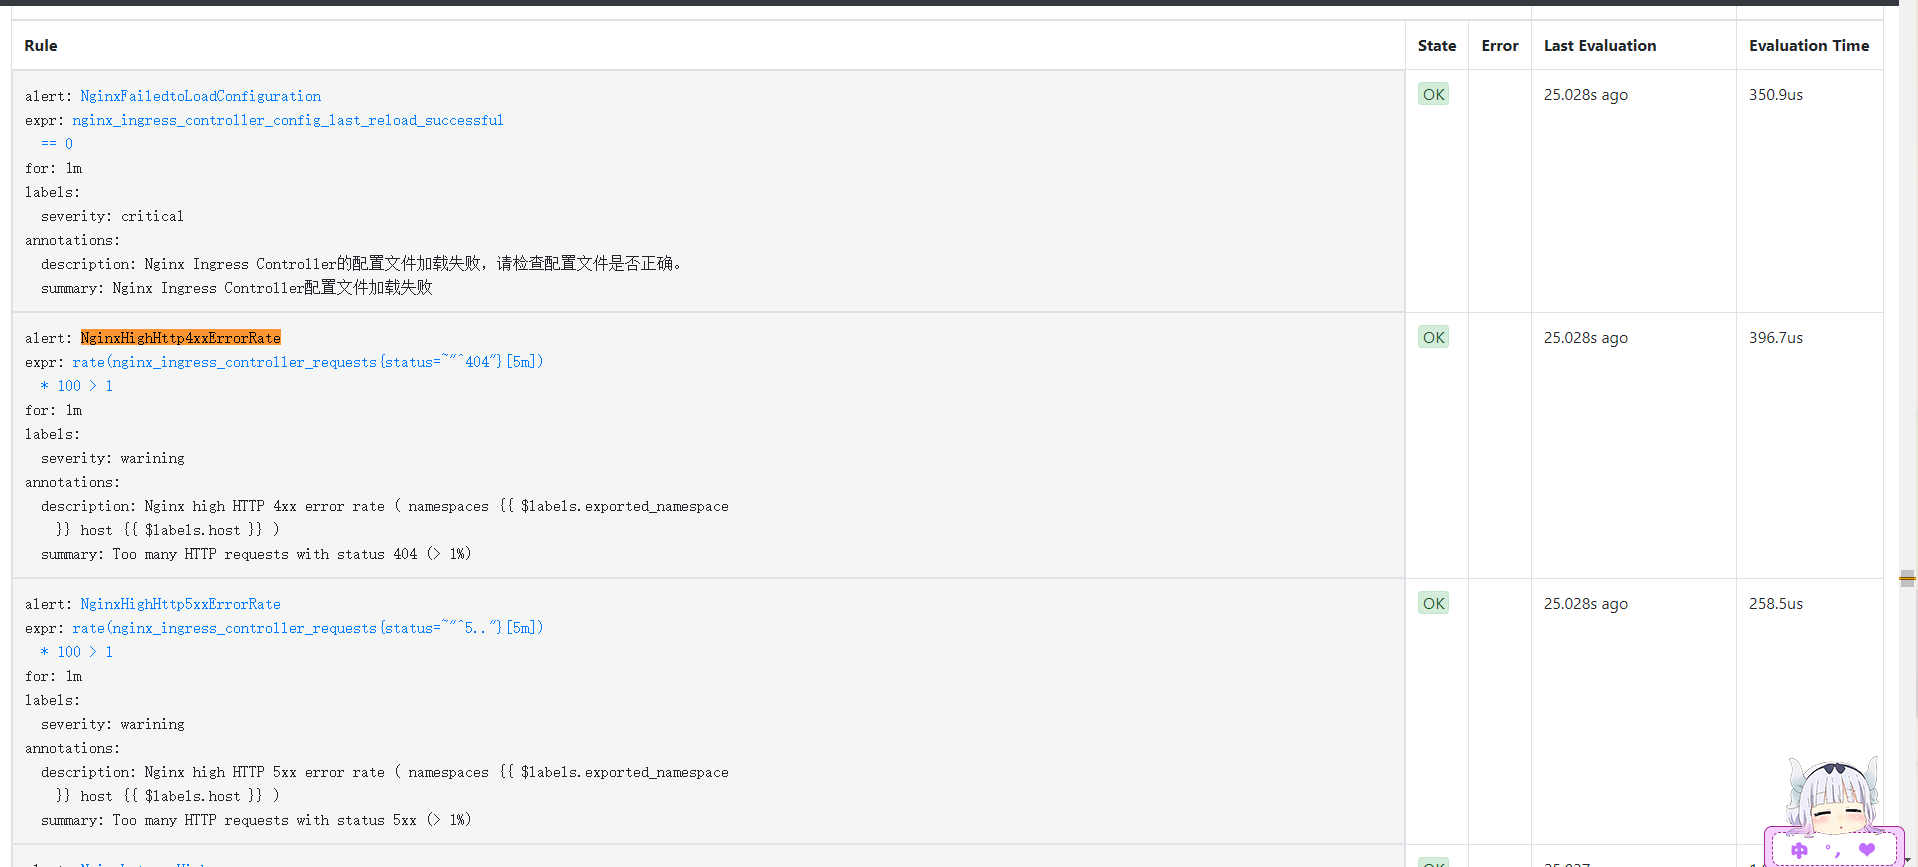
Adding alert rules
With scraping in place, the next step is alerting. The following PrometheusRule covers several useful scenarios:
- Nginx configuration reload failures
- High 404 rate
- High 5xx rate
- High p99 latency
- High request rate
- SSL/TLS certificates expiring within 15 days or 7 days
apiVersion: monitoring.coreos.com/v1
kind: PrometheusRule
metadata:
  labels:
    prometheus: k8s
    role: alert-rules
  name: nginx-ingress-rules
  namespace: monitoring
spec:
  groups:
  - name: nginx-ingress-rules
    rules:
    - alert: NginxFailedtoLoadConfiguration
      expr: nginx_ingress_controller_config_last_reload_successful == 0
      for: 1m
      labels:
        severity: critical
      annotations:
        summary: "Nginx Ingress Controller配置文件加载失败"
        description: "Nginx Ingress Controller的配置文件加载失败,请检查配置文件是否正确。"
    - alert: NginxHighHttp4xxErrorRate
      expr: rate(nginx_ingress_controller_requests{status=~"^404"}[5m]) * 100 > 1
      for: 1m
      labels:
        severity: warining
      annotations:
        description: Nginx high HTTP 4xx error rate ( namespaces {{ $labels.exported_namespace }} host {{ $labels.host }} )
        summary: "Too many HTTP requests with status 404 (> 1%)"
    - alert: NginxHighHttp5xxErrorRate
      expr: rate(nginx_ingress_controller_requests{status=~"^5.."}[5m]) * 100 > 1
      for: 1m
      labels:
        severity: warining
      annotations:
        description: Nginx high HTTP 5xx error rate ( namespaces {{ $labels.exported_namespace }} host {{ $labels.host }} )
        summary: "Too many HTTP requests with status 5xx (> 1%)"
    - alert: NginxLatencyHigh
      expr: histogram_quantile(0.99, sum(rate(nginx_ingress_controller_request_duration_seconds_bucket[2m])) by (host, node)) > 3
      for: 2m
      labels:
        severity: warining
      annotations:
        description: Nginx latency high ( namespaces {{ $labels.exported_namespace }} host {{ $labels.host }} )
        summary: "Nginx p99 latency is higher than 3 seconds"
    - alert: NginxHighRequestRate
      expr: rate(nginx_ingress_controller_nginx_process_requests_total[5m]) * 100 > 1000
      for: 1m
      labels:
        severity: warning
      annotations:
        description: Nginx ingress controller high request rate ( instance {{ $labels.instance }} namespaces {{ $labels.namespaces }} pod {{$labels.pod}})
        summary: "Nginx ingress controller high request rate (> 1000 requests per second)"
    - alert: SSLCertificateExpiration15day
      expr: nginx_ingress_controller_ssl_expire_time_seconds < 1296000
      for: 30m
      labels:
        severity: warning
      annotations:
        summary: SSL/TLS certificate for {{ $labels.host $labels.secret_name }} is about to expire
        description: The SSL/TLS certificate for {{ $labels.host $labels.secret_name }} will expire in less than 15 days.
    - alert: SSLCertificateExpiration7day
      expr: nginx_ingress_controller_ssl_expire_time_seconds < 604800
      for: 30m
      labels:
        severity: critical
      annotations:
        summary: SSL/TLS certificate for {{ $labels.host $labels.secret_name }} is about to expire
        description: The SSL/TLS certificate for {{ $labels.host $labels.secret_name }} will expire in less than 7 days.
Apply the rule and verify that it appears in the cluster:
[root@bt app]# kubectl apply -f ingress_rule_yaml
[root@bt app]# kubectl get prometheusrules.monitoring.coreos.com -n monitoring
NAME                              AGE
alertmanager-main-rules           24h
etcd-rules                        21h
kube-prometheus-rules             24h
kube-state-metrics-rules          24h
kubernetes-monitoring-rules       24h
nginx-ingress-rules               11s
node-exporter-rules               24h
prometheus-k8s-prometheus-rules   24h
prometheus-operator-rules         24h
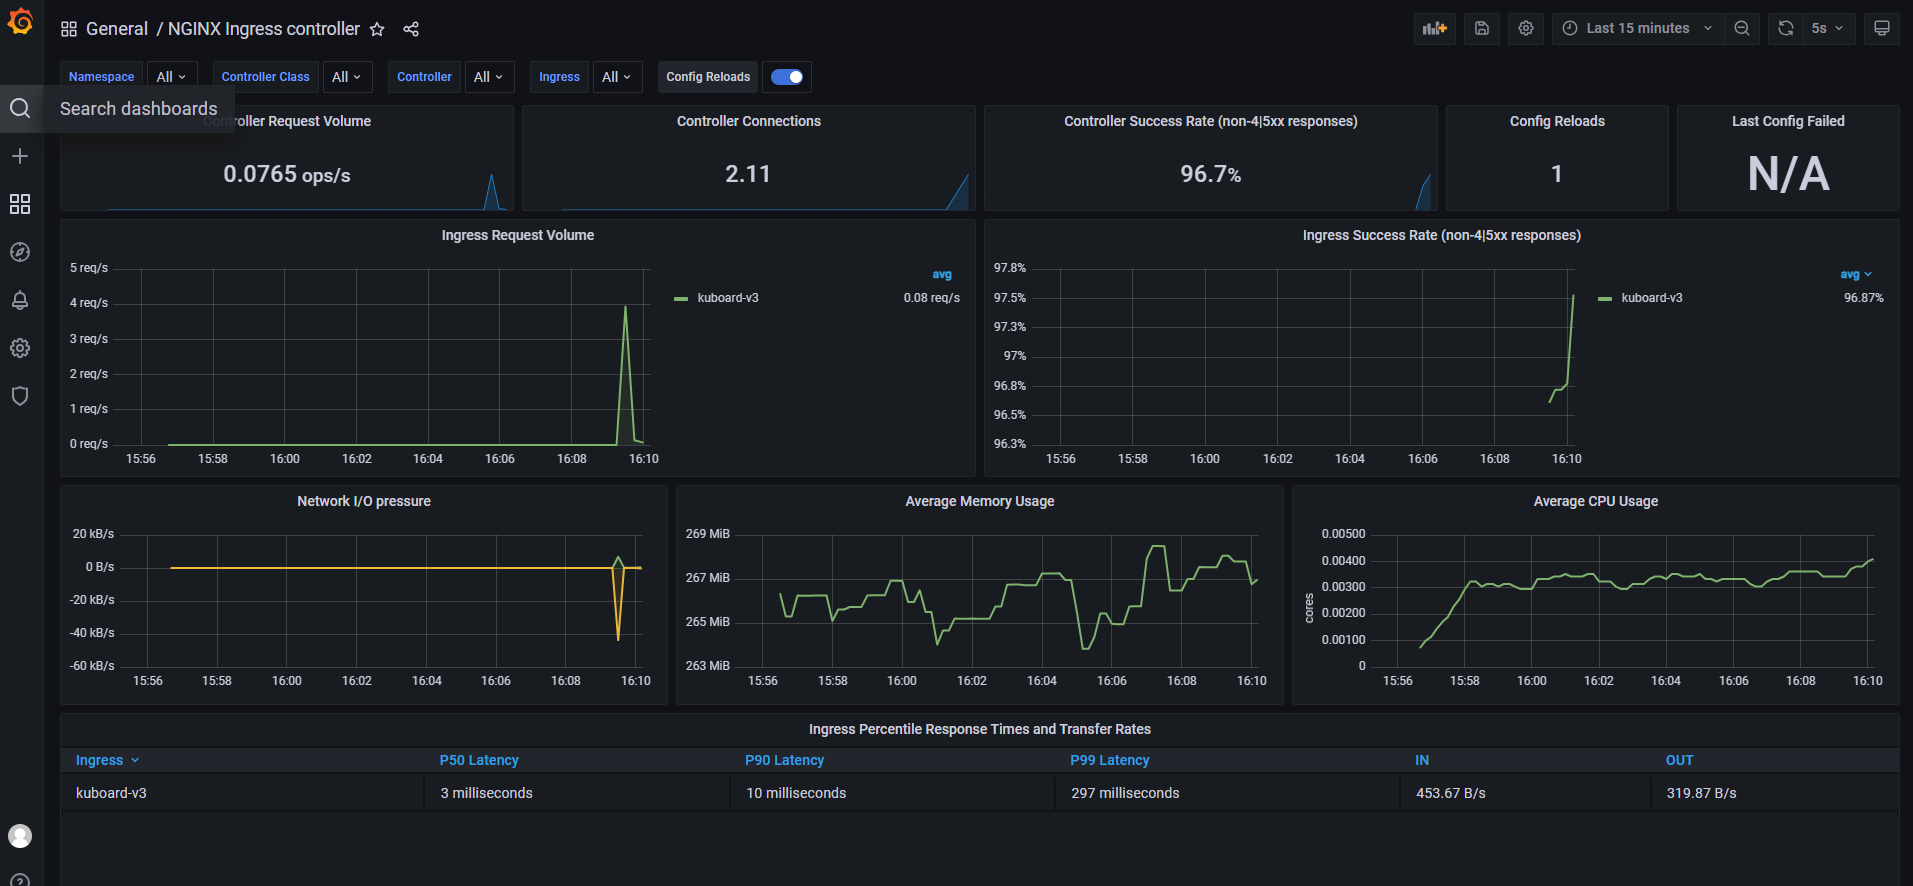
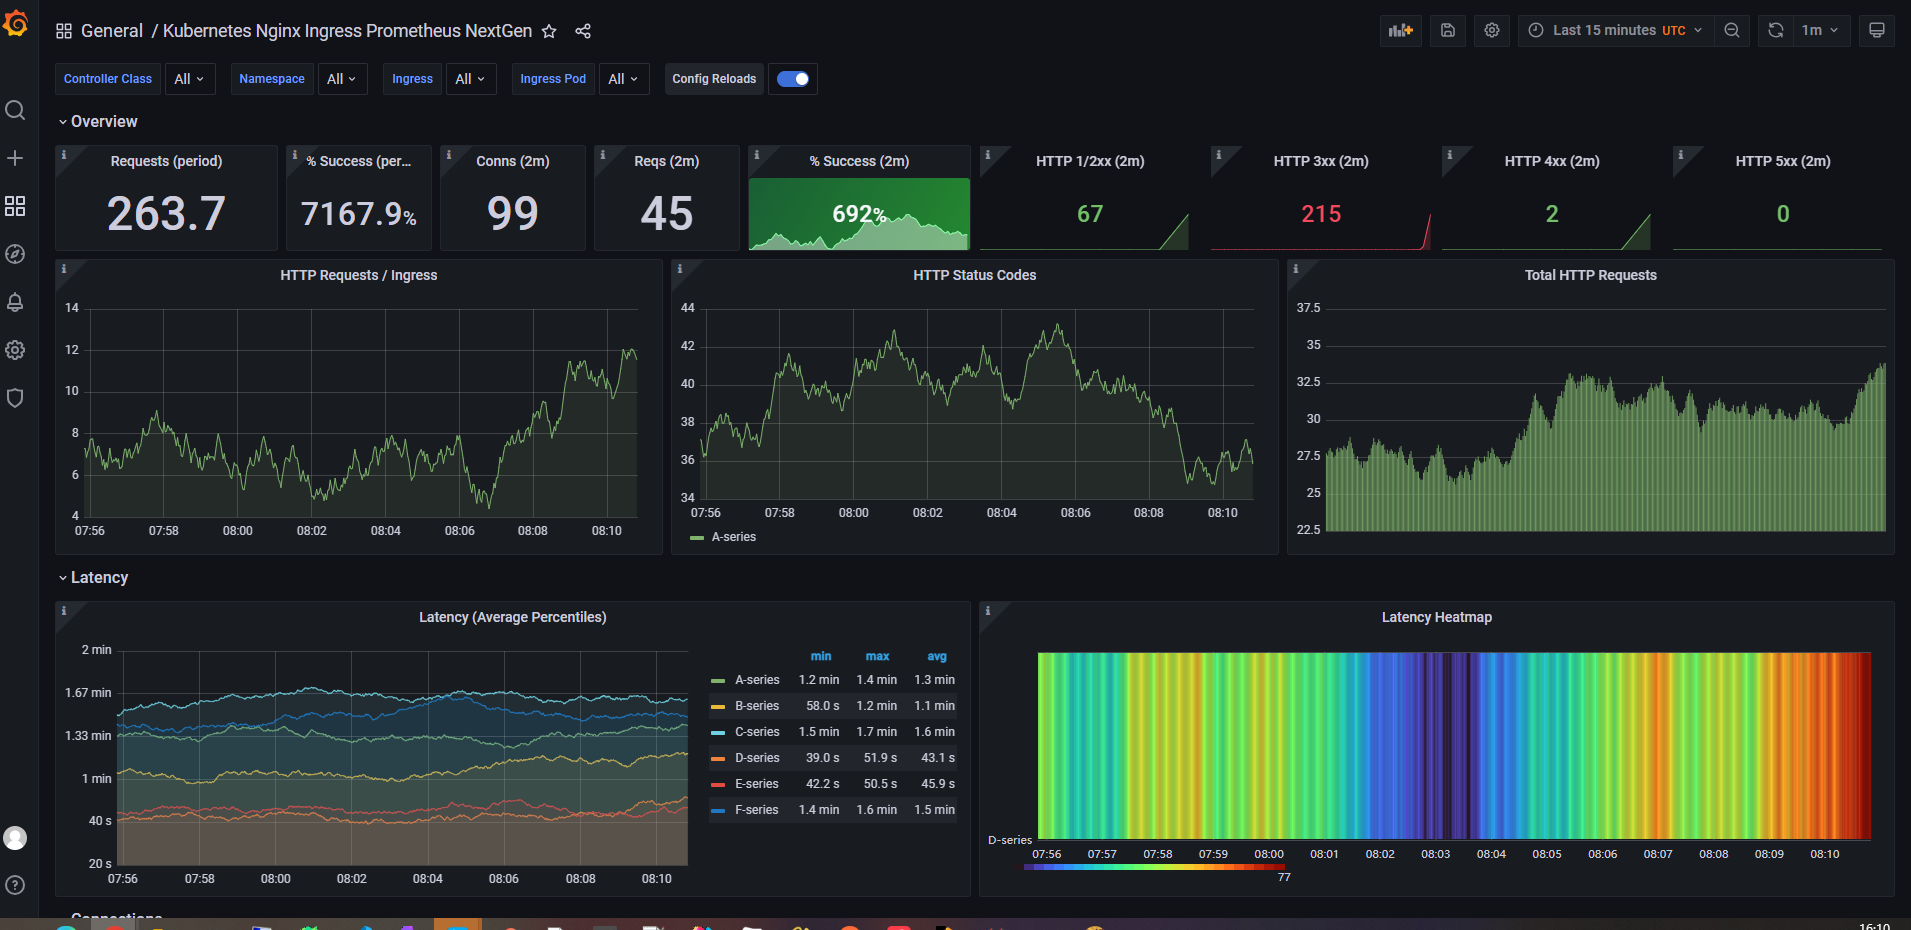
Grafana dashboards
For visualization, two ready-made Grafana dashboard templates were used for ingress-nginx:
961414314
Looking at the exposed metrics
You can inspect all metrics directly from the controller endpoint:
curl http://172.21.20.203:10254/metrics
Prometheus periodically pulls data from this endpoint. To list only the metric names, the following command is useful:
curl http://172.21.20.203:10254/metrics | grep -Ev '^#' |awk -F '{' '{print $1}' | sort | uniq | awk '{print $1}'
Example output:
[root@bt ~]# curl http://172.21.20.203:10254/metrics | grep -Ev '^#' |awk -F '{' '{print $1}' | sort | uniq | awk '{print $1}'
% Total    % Received % Xferd  Average Speed   Time    Time     Time  Current
                                 Dload  Upload   Total   Spent    Left  Speed
100  291k    0  291k    0     0  6654k      0 --:--:-- --:--:-- --:--:-- 6781k
go_gc_duration_seconds
go_gc_duration_seconds_count
go_gc_duration_seconds_sum
go_goroutines
go_info
go_memstats_alloc_bytes
go_memstats_alloc_bytes_total
go_memstats_buck_hash_sys_bytes
go_memstats_frees_total
go_memstats_gc_cpu_fraction
go_memstats_gc_sys_bytes
go_memstats_heap_alloc_bytes
go_memstats_heap_idle_bytes
go_memstats_heap_inuse_bytes
go_memstats_heap_objects
go_memstats_heap_released_bytes
go_memstats_heap_sys_bytes
go_memstats_last_gc_time_seconds
go_memstats_lookups_total
go_memstats_mallocs_total
go_memstats_mcache_inuse_bytes
go_memstats_mcache_sys_bytes
go_memstats_mspan_inuse_bytes
go_memstats_mspan_sys_bytes
go_memstats_next_gc_bytes
go_memstats_other_sys_bytes
go_memstats_stack_inuse_bytes
go_memstats_stack_sys_bytes
go_memstats_sys_bytes
go_threads
nginx_ingress_controller_bytes_sent_bucket
nginx_ingress_controller_bytes_sent_count
nginx_ingress_controller_bytes_sent_sum
nginx_ingress_controller_config_hash
nginx_ingress_controller_config_last_reload_successful
nginx_ingress_controller_config_last_reload_successful_timestamp_seconds
nginx_ingress_controller_ingress_upstream_latency_seconds
nginx_ingress_controller_ingress_upstream_latency_seconds_count
nginx_ingress_controller_ingress_upstream_latency_seconds_sum
nginx_ingress_controller_leader_election_status
nginx_ingress_controller_nginx_process_connections
nginx_ingress_controller_nginx_process_connections_total
nginx_ingress_controller_nginx_process_cpu_seconds_total
nginx_ingress_controller_nginx_process_num_procs
nginx_ingress_controller_nginx_process_oldest_start_time_seconds
nginx_ingress_controller_nginx_process_read_bytes_total
nginx_ingress_controller_nginx_process_requests_total
nginx_ingress_controller_nginx_process_resident_memory_bytes
nginx_ingress_controller_nginx_process_virtual_memory_bytes
nginx_ingress_controller_nginx_process_write_bytes_total
nginx_ingress_controller_request_duration_seconds_bucket
nginx_ingress_controller_request_duration_seconds_count
nginx_ingress_controller_request_duration_seconds_sum
nginx_ingress_controller_requests
nginx_ingress_controller_request_size_bucket
nginx_ingress_controller_request_size_count
nginx_ingress_controller_request_size_sum
nginx_ingress_controller_response_duration_seconds_bucket
nginx_ingress_controller_response_duration_seconds_count
nginx_ingress_controller_response_duration_seconds_sum
nginx_ingress_controller_response_size_bucket
nginx_ingress_controller_response_size_count
nginx_ingress_controller_response_size_sum
nginx_ingress_controller_ssl_expire_time_seconds
nginx_ingress_controller_success
process_cpu_seconds_total
process_max_fds
process_open_fds
process_resident_memory_bytes
process_start_time_seconds
process_virtual_memory_bytes
process_virtual_memory_max_bytes
promhttp_metric_handler_requests_in_flight
promhttp_metric_handler_requests_total
[root@bt ~]#
The metrics beginning with go_ are mostly about the monitoring process itself rather than Ingress traffic behavior, so the more relevant part starts with the nginx_ingress_controller_*, process_*, and promhttp_* families.
Below is a practical summary of the main metrics exposed by the controller.
nginx_ingress_controller_bytes_sent_bucket: Distribution of bytes sent in requests, typically as part of a histogram used for percentile calculations.nginx_ingress_controller_bytes_sent_count: Total number of observations for bytes sent.nginx_ingress_controller_bytes_sent_sum: Total volume of bytes sent across requests.nginx_ingress_controller_config_hash: Hash of the current Nginx configuration, useful for detecting config changes.nginx_ingress_controller_config_last_reload_successful: Whether the last Nginx configuration reload succeeded (1) or failed (0).nginx_ingress_controller_config_last_reload_successful_timestamp_seconds: Timestamp of the last successful Nginx configuration reload.nginx_ingress_controller_ingress_upstream_latency_seconds: Latency from Ingress to the upstream service.nginx_ingress_controller_ingress_upstream_latency_seconds_count: Count of upstream latency observations.nginx_ingress_controller_ingress_upstream_latency_seconds_sum: Sum of upstream latency observations.nginx_ingress_controller_leader_election_status: Indicates whether the current controller instance is the leader.nginx_ingress_controller_nginx_process_connections: Current active Nginx process connections.nginx_ingress_controller_nginx_process_connections_total: Total connections handled by the Nginx process.nginx_ingress_controller_nginx_process_cpu_seconds_total: Total CPU time consumed by the Nginx process.nginx_ingress_controller_nginx_process_num_procs: Number of Nginx processes.nginx_ingress_controller_nginx_process_oldest_start_time_seconds: Start time of the oldest Nginx process.nginx_ingress_controller_nginx_process_read_bytes_total: Total bytes read by the Nginx process.nginx_ingress_controller_nginx_process_requests_total: Total number of requests handled by the Nginx process.nginx_ingress_controller_nginx_process_resident_memory_bytes: Resident memory used by the Nginx process.nginx_ingress_controller_nginx_process_virtual_memory_bytes: Virtual memory used by the Nginx process.nginx_ingress_controller_nginx_process_write_bytes_total: Total bytes written by the Nginx process.nginx_ingress_controller_request_duration_seconds_bucket: Distribution of request processing time.nginx_ingress_controller_request_duration_seconds_count: Count of request duration observations.nginx_ingress_controller_request_duration_seconds_sum: Sum of request durations.nginx_ingress_controller_requests: Total processed requests.nginx_ingress_controller_request_size_bucket: Distribution of request sizes.nginx_ingress_controller_request_size_count: Count of request size observations.nginx_ingress_controller_request_size_sum: Sum of request sizes.nginx_ingress_controller_response_duration_seconds_bucket: Distribution of response durations.nginx_ingress_controller_response_duration_seconds_count: Count of response duration observations.nginx_ingress_controller_response_duration_seconds_sum: Sum of response durations.nginx_ingress_controller_response_size_bucket: Distribution of response sizes.nginx_ingress_controller_response_size_count: Count of response size observations.nginx_ingress_controller_response_size_sum: Sum of response sizes.nginx_ingress_controller_ssl_expire_time_seconds: SSL certificate expiration time.nginx_ingress_controller_success: Count of successfully handled requests.process_cpu_seconds_total: Total CPU time consumed by the process.process_max_fds: Maximum number of file descriptors the process can open.process_open_fds: Number of file descriptors currently open.process_resident_memory_bytes: Resident memory size of the process.process_start_time_seconds: Process start time.process_virtual_memory_bytes: Virtual memory size of the process.process_virtual_memory_max_bytes: Maximum virtual memory available to the process.promhttp_metric_handler_requests_in_flight: Current number of in-flight requests handled by the metrics handler.promhttp_metric_handler_requests_total: Total number of requests handled by the metrics handler.
In practice, the most useful signals usually come from a combination of these metrics rather than from any single one alone: request volume, 4xx/5xx error rate, latency percentiles, Nginx configuration reload health, process resource usage, and SSL certificate expiry.
Once those are scraped by Prometheus, connected to alert rules, and visualized in Grafana, Ingress becomes much easier to operate with confidence.