Symptom
The failure first shows up clearly in dmesg_TZ.txt. The log keeps printing IRQ diagnostics, and the key detail is that IRQ 193 is being handled by handle_bad_irq instead of a real registered interrupt handler:
[   14.540023][    C0] print_irq_desc: 550553 callbacks suppressed
[   14.540038][    C0] irq 193, desc: 000000005e8b6ab6, depth: 1, count: 0, unhandled: 0
[   14.540049][    C0] ->handle_irq():  00000000c765d680, handle_bad_irq.cfi_jt+0x0/0x8 [pinctrl_msm]
[   14.540081][    C0] ->irq_data.chip(): 000000004510a501, 0xffffff8004e94370
[   14.540088][    C0] ->action(): 0000000000000000
[   14.540117][    C0] irq 193, desc: 000000005e8b6ab6, depth: 1, count: 0, unhandled: 0
[   14.540124][    C0] ->handle_irq():  00000000c765d680, handle_bad_irq.cfi_jt+0x0/0x8 [pinctrl_msm]
[   14.540149][    C0] ->irq_data.chip(): 000000004510a501, 0xffffff8004e94370
[   14.540155][    C0] ->action(): 0000000000000000
[   14.540170][    C0] irq 193, desc: 000000005e8b6ab6, depth: 1, count: 0, unhandled: 0
[   14.540177][    C0] ->handle_irq():  00000000c765d680, handle_bad_irq.cfi_jt+0x0/0x8 [pinctrl_msm]
[   14.540201][    C0] ->irq_data.chip(): 000000004510a501, 0xffffff8004e94370
[   14.540207][    C0] ->action(): 0000000000000000
[   14.540222][    C0] irq 193, desc: 000000005e8b6ab6, depth: 1, count: 0, unhandled: 0
[   14.540229][    C0] ->handle_irq():  00000000c765d680, handle_bad_irq.cfi_jt+0x0/0x8 [pinctrl_msm]
[   14.540253][    C0] ->irq_data.chip(): 000000004510a501, 0xffffff8004e94370
[   14.540260][    C0] ->action(): 0000000000000000
[   14.540274][    C0] irq 193, desc: 000000005e8b6ab6, depth: 1, count: 0, unhandled: 0
[   14.540281][    C0] ->handle_irq():  00000000c765d680, handle_bad_irq.cfi_jt+0x0/0x8 [pinctrl_msm]
[   14.540305][    C0] ->irq_data.chip(): 000000004510a501, 0xffffff8004e94370
[   14.540312][    C0] ->action(): 0000000000000000
[   18.730482][    C0] msm_watchdog f017000.qcom,wdt: QCOM Apps Watchdog bark! Now = 18.730478
[   18.730491][    C0] msm_watchdog f017000.qcom,wdt: QCOM Apps Watchdog last pet at 1.370438
[   18.730500][    C0] msm_watchdog f017000.qcom,wdt: cpu alive mask from last pet 00
[   18.733076][    C0] (virq:irq_count)- 193:1010493 GICv3:arch_timer(11):26533 GICv3:IPI(1):10295 GICv3:IPI(2):7108 GICv3:mmc0(36):2248 GICv3:IPI(6):2057 GICv3:arch_mem_timer(13):297 GICv3:glink-native-rpm-glink(33):264 GICv3:i2c_geni(176):247 GICv3:i2c_geni(177):203
[   18.733122][    C0] (cpu:irq_count)- 0:1016625 1:4303 2:4356 3:4370 4:9624 5:6426 6:6920 7:7363
[   18.733147][    C0] (ipi:irq_count)- 0:10295 1:7108 2:0 3:0 4:45 5:2057 6:0
[   18.733170][    C0] msm_watchdog f017000.qcom,wdt: Causing a QCOM Apps Watchdog bite!
[   18.741016][    C0] msm_watchdog f017000.qcom,wdt: Wdog - STS: 0xb0272, CTL: 0x3, BARK TIME: 0x57fdf, BITE TIME: 0x6ffd6
A few things stand out immediately:
->action(): 0000000000000000- the interrupt path goes into
handle_bad_irq - the watchdog eventually barks and bites
That combination is typical of an interrupt storm: the line keeps firing, but there is no valid registered handler to consume it, so the CPU gets stuck servicing a bad IRQ until the watchdog forces a panic.
What the log tells us
The irq_desc output already gives away the root direction. Since action is 0, the kernel has no interrupt action registered for this IRQ. In other words, the interrupt is active in hardware, but no driver has successfully claimed it.
The watchdog statistics make the impact obvious. IRQ 193 was triggered 1010493 times:
(virq:irq_count)- 193:1010493
That is not a normal one-off spurious interrupt. It is a full interrupt storm, and it is severe enough to starve the system until the Qualcomm apps watchdog resets it.
Mapping IRQ 193 back to hardware
The next step is to identify what IRQ 193 actually corresponds to.
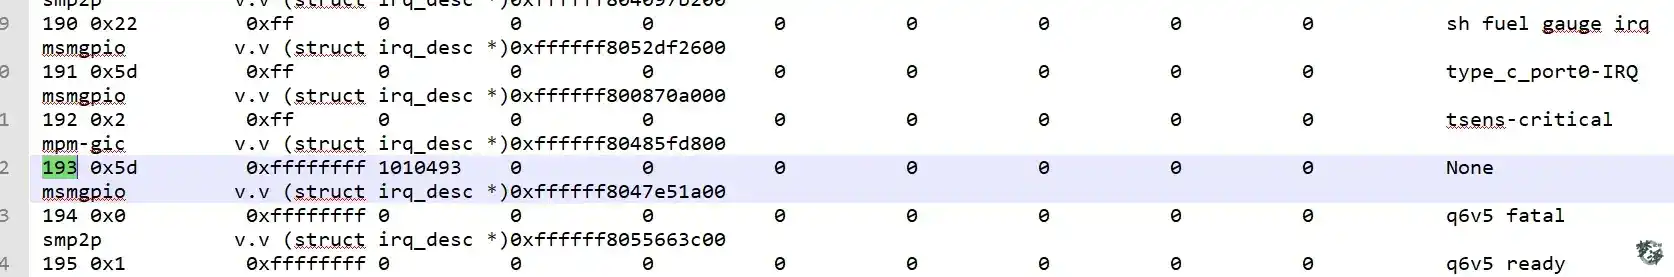
Using the interrupt address shown in the log, 0xffffff8047e51a00, it can be examined in Trace32:
v.v (struct irq_desc *)0xffffff8047e51a00
The result is:
  (struct irq_desc *)0xffffff8047e51a00 = 0xFFFFFF8047E51A00 -> (

irq_common_data = (state_use_accessors = 33751040, handler_data = 0x0, msi_desc = 0x0, affinity = ((bits = (18446744073709551615))), effective_affinity = ((bits = (0))), ipi_offset = 0),

irq_data = (

mask = 0,

irq = 193,

hwirq_=_93, //------------------------------>   gpio93

common = 0xFFFFFF8047E51A00,

chip = 0xFFFFFF8004E94370,

domain = 0xFFFFFF800A7DA800,

parent_data = 0xFFFFFF80298FF280,

chip_data = 0xFFFFFF8004E94090),

kstat_irqs = 0x0000005A54ED7954,

handle_irq = 0xFFFFFFDE5DB97878,

action = 0x0,  //------------------------------>  为空
This confirms two important facts:
irq = 193hwirq = 93, which maps to gpio93
So the problem is no longer just "IRQ 193 is storming". It becomes much more concrete: GPIO 93 is generating interrupts, but the corresponding IRQ action is empty.
Device tree check
After tracing the GPIO usage in the codebase, GPIO 93 turned up in the device tree with the following configuration:
qcom,irq-gpio = <&tlmm 93 0x8008>;
interrupt-parent = <&tlmm>;
interrupts = <93 0>;
interrupt-names = "wusb3801_int_irq";

wusb3801,reset-gpio = <&tlmm 93 0x0>;
This is the critical clue.
The same GPIO was declared both as an interrupt source and as a reset GPIO:
qcom,irq-gpio = <&tlmm 93 0x8008>;interrupts = <93 0>;wusb3801,reset-gpio = <&tlmm 93 0x0>;
That overlap is enough to explain the bad behavior. GPIO 93 was being used in a conflicting way, which led to the interrupt being triggered without a proper registered handler behind it.
Resolution
Once this GPIO configuration was removed, the system returned to normal.
In other words, the panic was not caused by a generic kernel instability issue. The real trigger was a device-tree-level GPIO misuse that created an interrupt storm on GPIO 93, sent execution into handle_bad_irq, and eventually caused the watchdog to bite.
When investigating similar watchdog panics, two checks are especially valuable:
- whether
irq_desc.actionis null - whether a rapidly increasing IRQ count maps back to a GPIO that is incorrectly declared or reused in the device tree
In this case, both pointed directly to the same conclusion: an unregistered interrupt on GPIO 93 caused the storm.